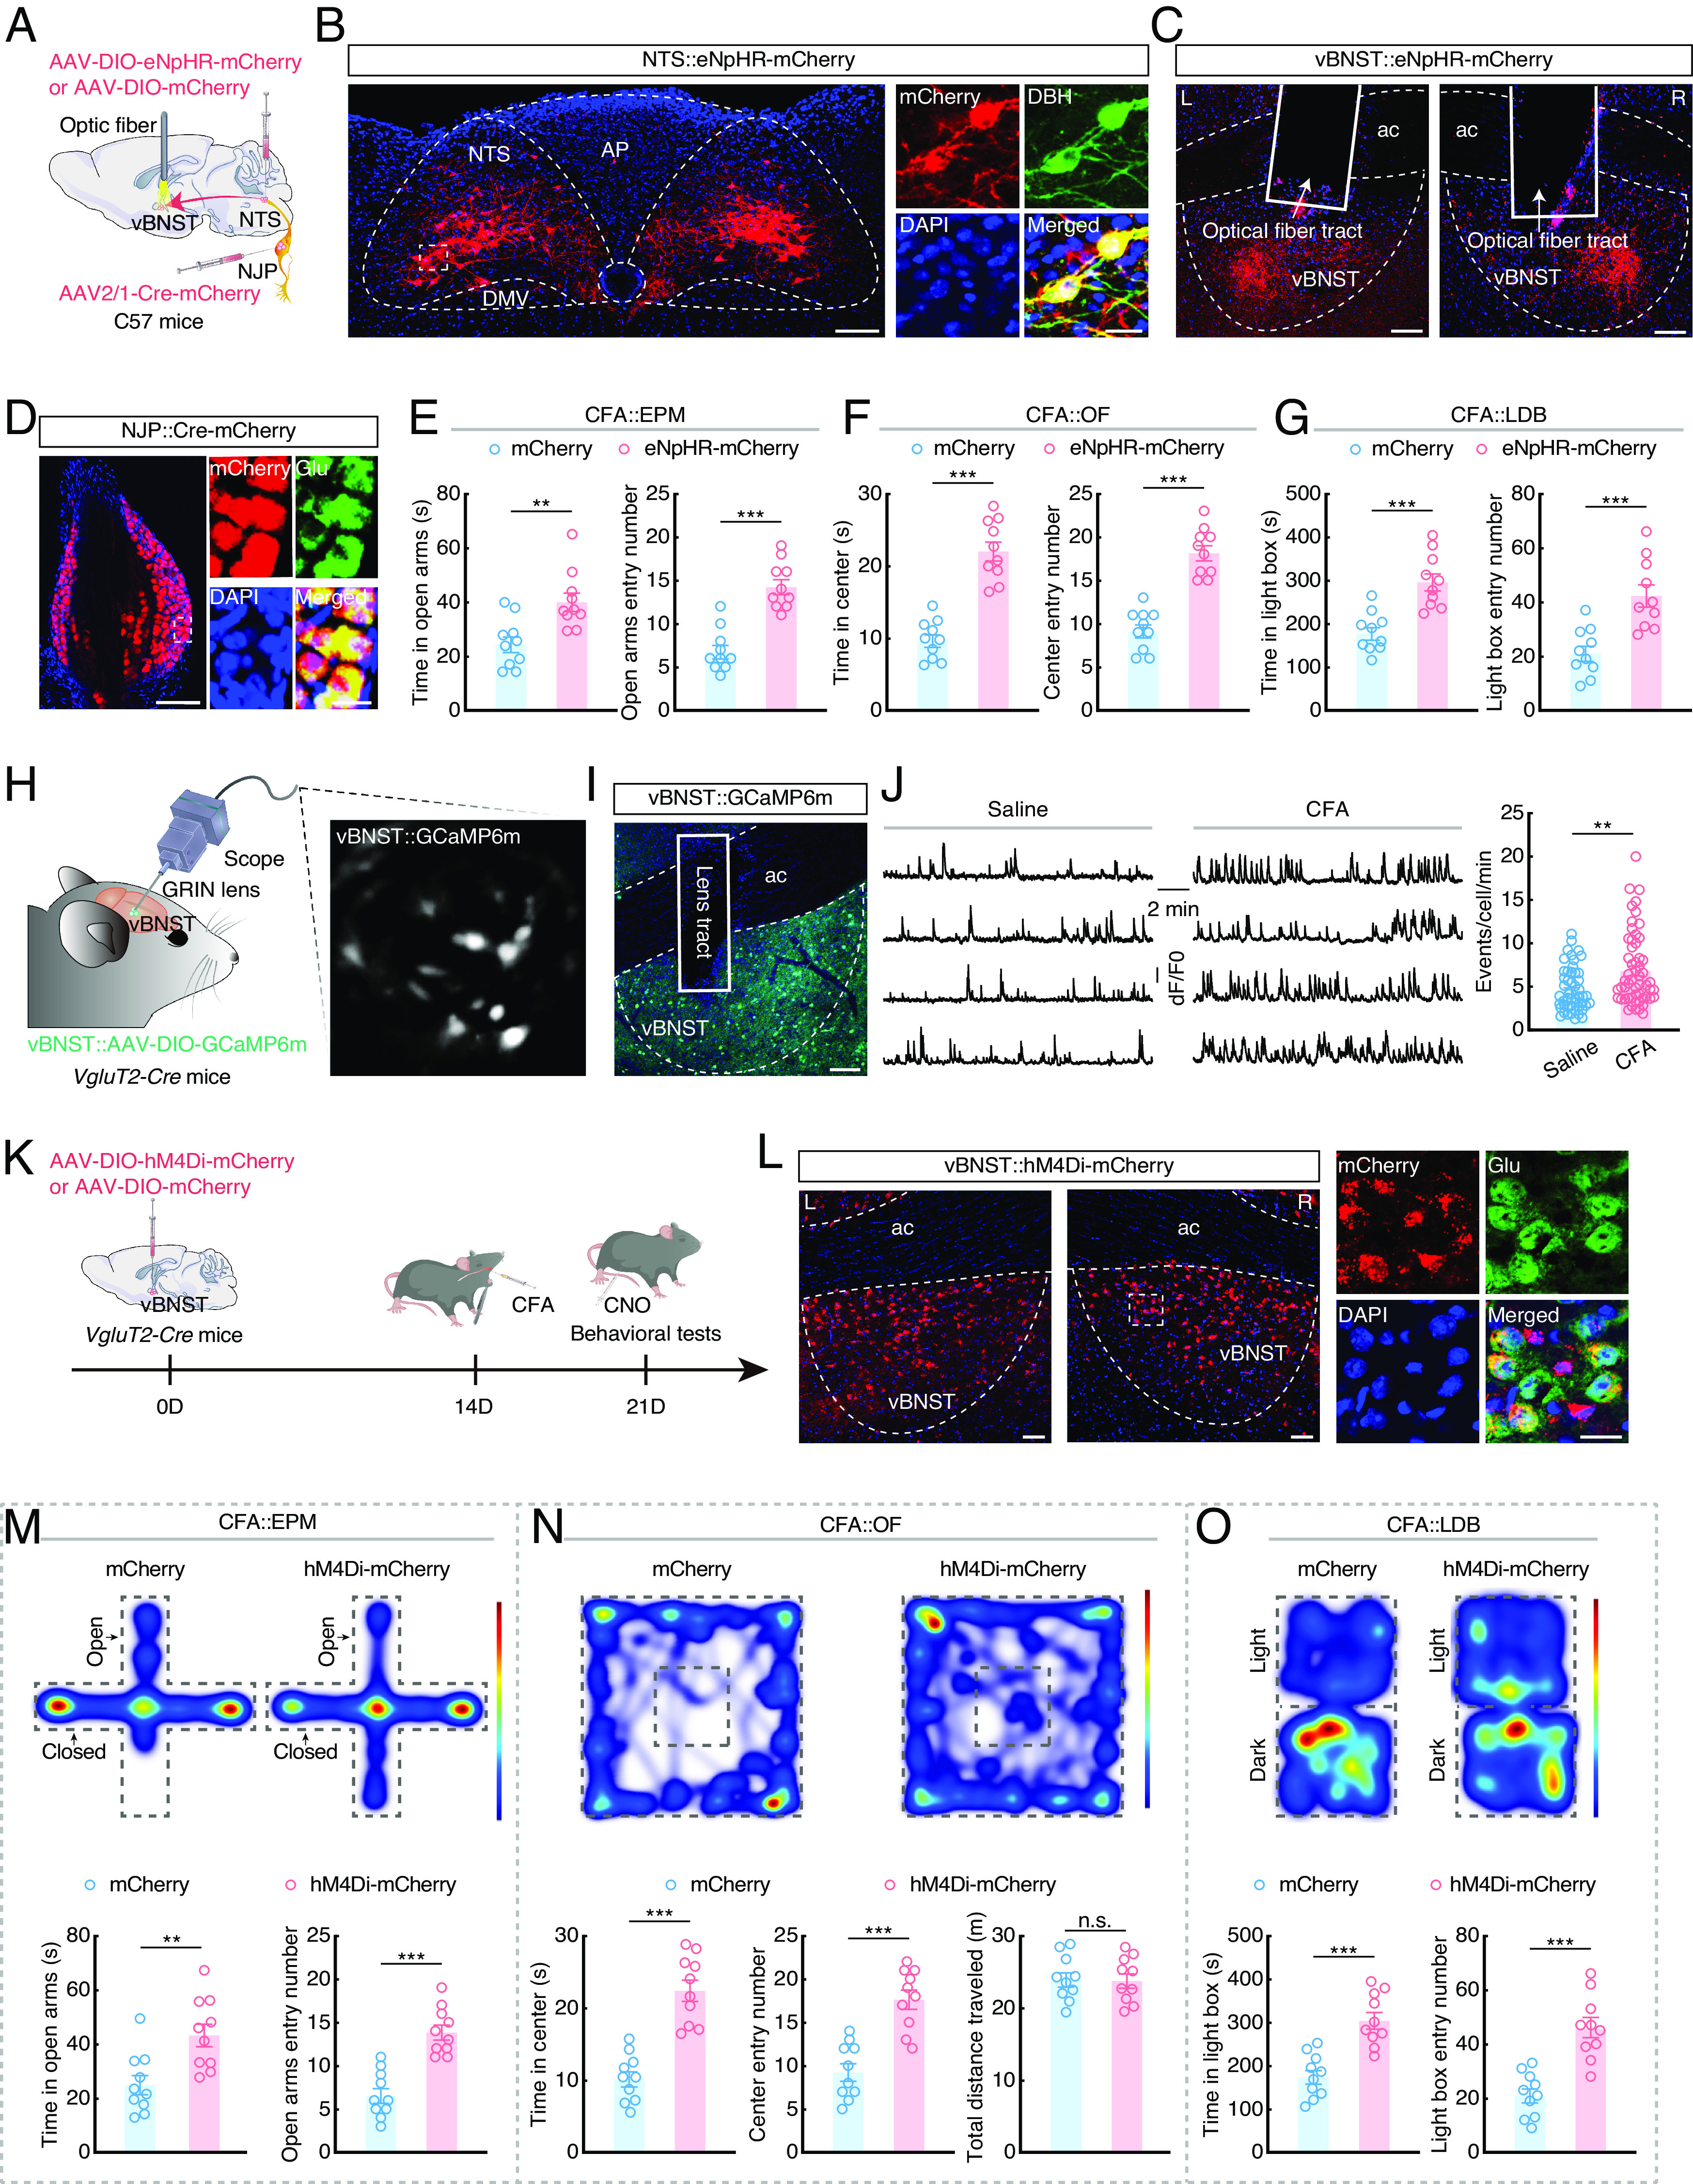
Fig. 5.

Inhibiting the NJP→NTSNE→vBNST circuit can reduce anxiety-like behaviors in CFA mice. (A) Schematic of the optogenetic inhibition of the NJP→NTSNE→vBNST circuit. (B) Representative images showing the expression of eNpHR-mCherry in the NTS, and mCherry+ neurons being detected by DBH antibody. (Scale bars, 100 µm [Left] or 20 µm [Right].) (C) Representative images of the projection fibers and optical fiber placement in the vBNST. (Scale bars, 100 µm.) L: Left; R: right. (D) Representative images showing the expression of virus in NJP neurons (Left) and mCherry+ neurons colocalized with glutamate antibody (Right). (Scale bars, 50 µm [Left] or 20 µm [Right].) (E) Summarized data for the EPM test with mCherry and eNpHR-mCherry CFA mice (n = 10 mice per group; Left, t18 = 3.518, P = 0.0025; Right, t18 = 6.460, P < 0.0001). (F) Summarized data for the OF test with mCherry and eNpHR-mCherry CFA mice (n = 0 mice per group; Left, t18 = 7.908, P < 0.0001; Right, t18 = 7.853, P < 0.0001). (G) Summarized data for the LDB test with mCherry and eNpHR-mCherry CFA mice (n = 10 mice per group; Left, t18 = 4.868, P = 0.0001; Right, t18 = 4.292, P = 0.0004). (H) Schematic of the viral injection and microendoscopic imaging in freely moving mice. (I) Representative image showing the expression of GCaMP6m and the GRIN lens tract in the vBNST. (Scale bar, 100 µm.) (J) Sample traces (Left) and summarized data (Right) showing the spontaneous Ca2+ transient frequency of vBNSTGlu neurons from saline and CFA mice (Saline, n = 50 cells; CFA, n = 57 cells; U = 913, P = 0.0012). (K) Schematic of viral injection and chemogenetic inhibition design. (L) Representative images showing the expression of hM4Di-mCherry in the vBNST (Left) and colocalized with glutamate antibody (Right). (Scale bars, 50 µm [Left] or 20 µm [Right].) L: Left; R: Right. (M) Representative heatmaps of the travel trajectory and summarized data for the EPM test with mCherry and hM4Di-mCherry CFA mice (after injection of CNO; n = 10 mice per group; Left, t18 = 3.360, P = 0.0035; Right, t18 = 6.072, P < 0.0001). (N) Representative heatmaps of the travel trajectory and summarized data for the OF test with mCherry and hM4Di-mCherry CFA mice (after injection of CNO; n = 10 mice per group; Left, t18 = 6.771, P < 0.0001; Middle, t18 = 5.607, P < 0.0001; Right, t18 = 0.1231, P = 0.9034). (O) Representative heatmaps of the travel trajectory and summarized data for the LDB test with mCherry and hM4Di-mCherry CFA mice (after injection of CNO; n = 10 mice per group; Left, t18= 5.282, P < 0.0001; Right, t18 = 5.426, P < 0.0001). Significance was assessed by two-tailed unpaired Student’s t tests in (E–G and M–O), and Mann–Whitney U test in (J). All data are presented as the mean ± SEM. **P < 0.01; ***P < 0.001, n.s., not significant.
