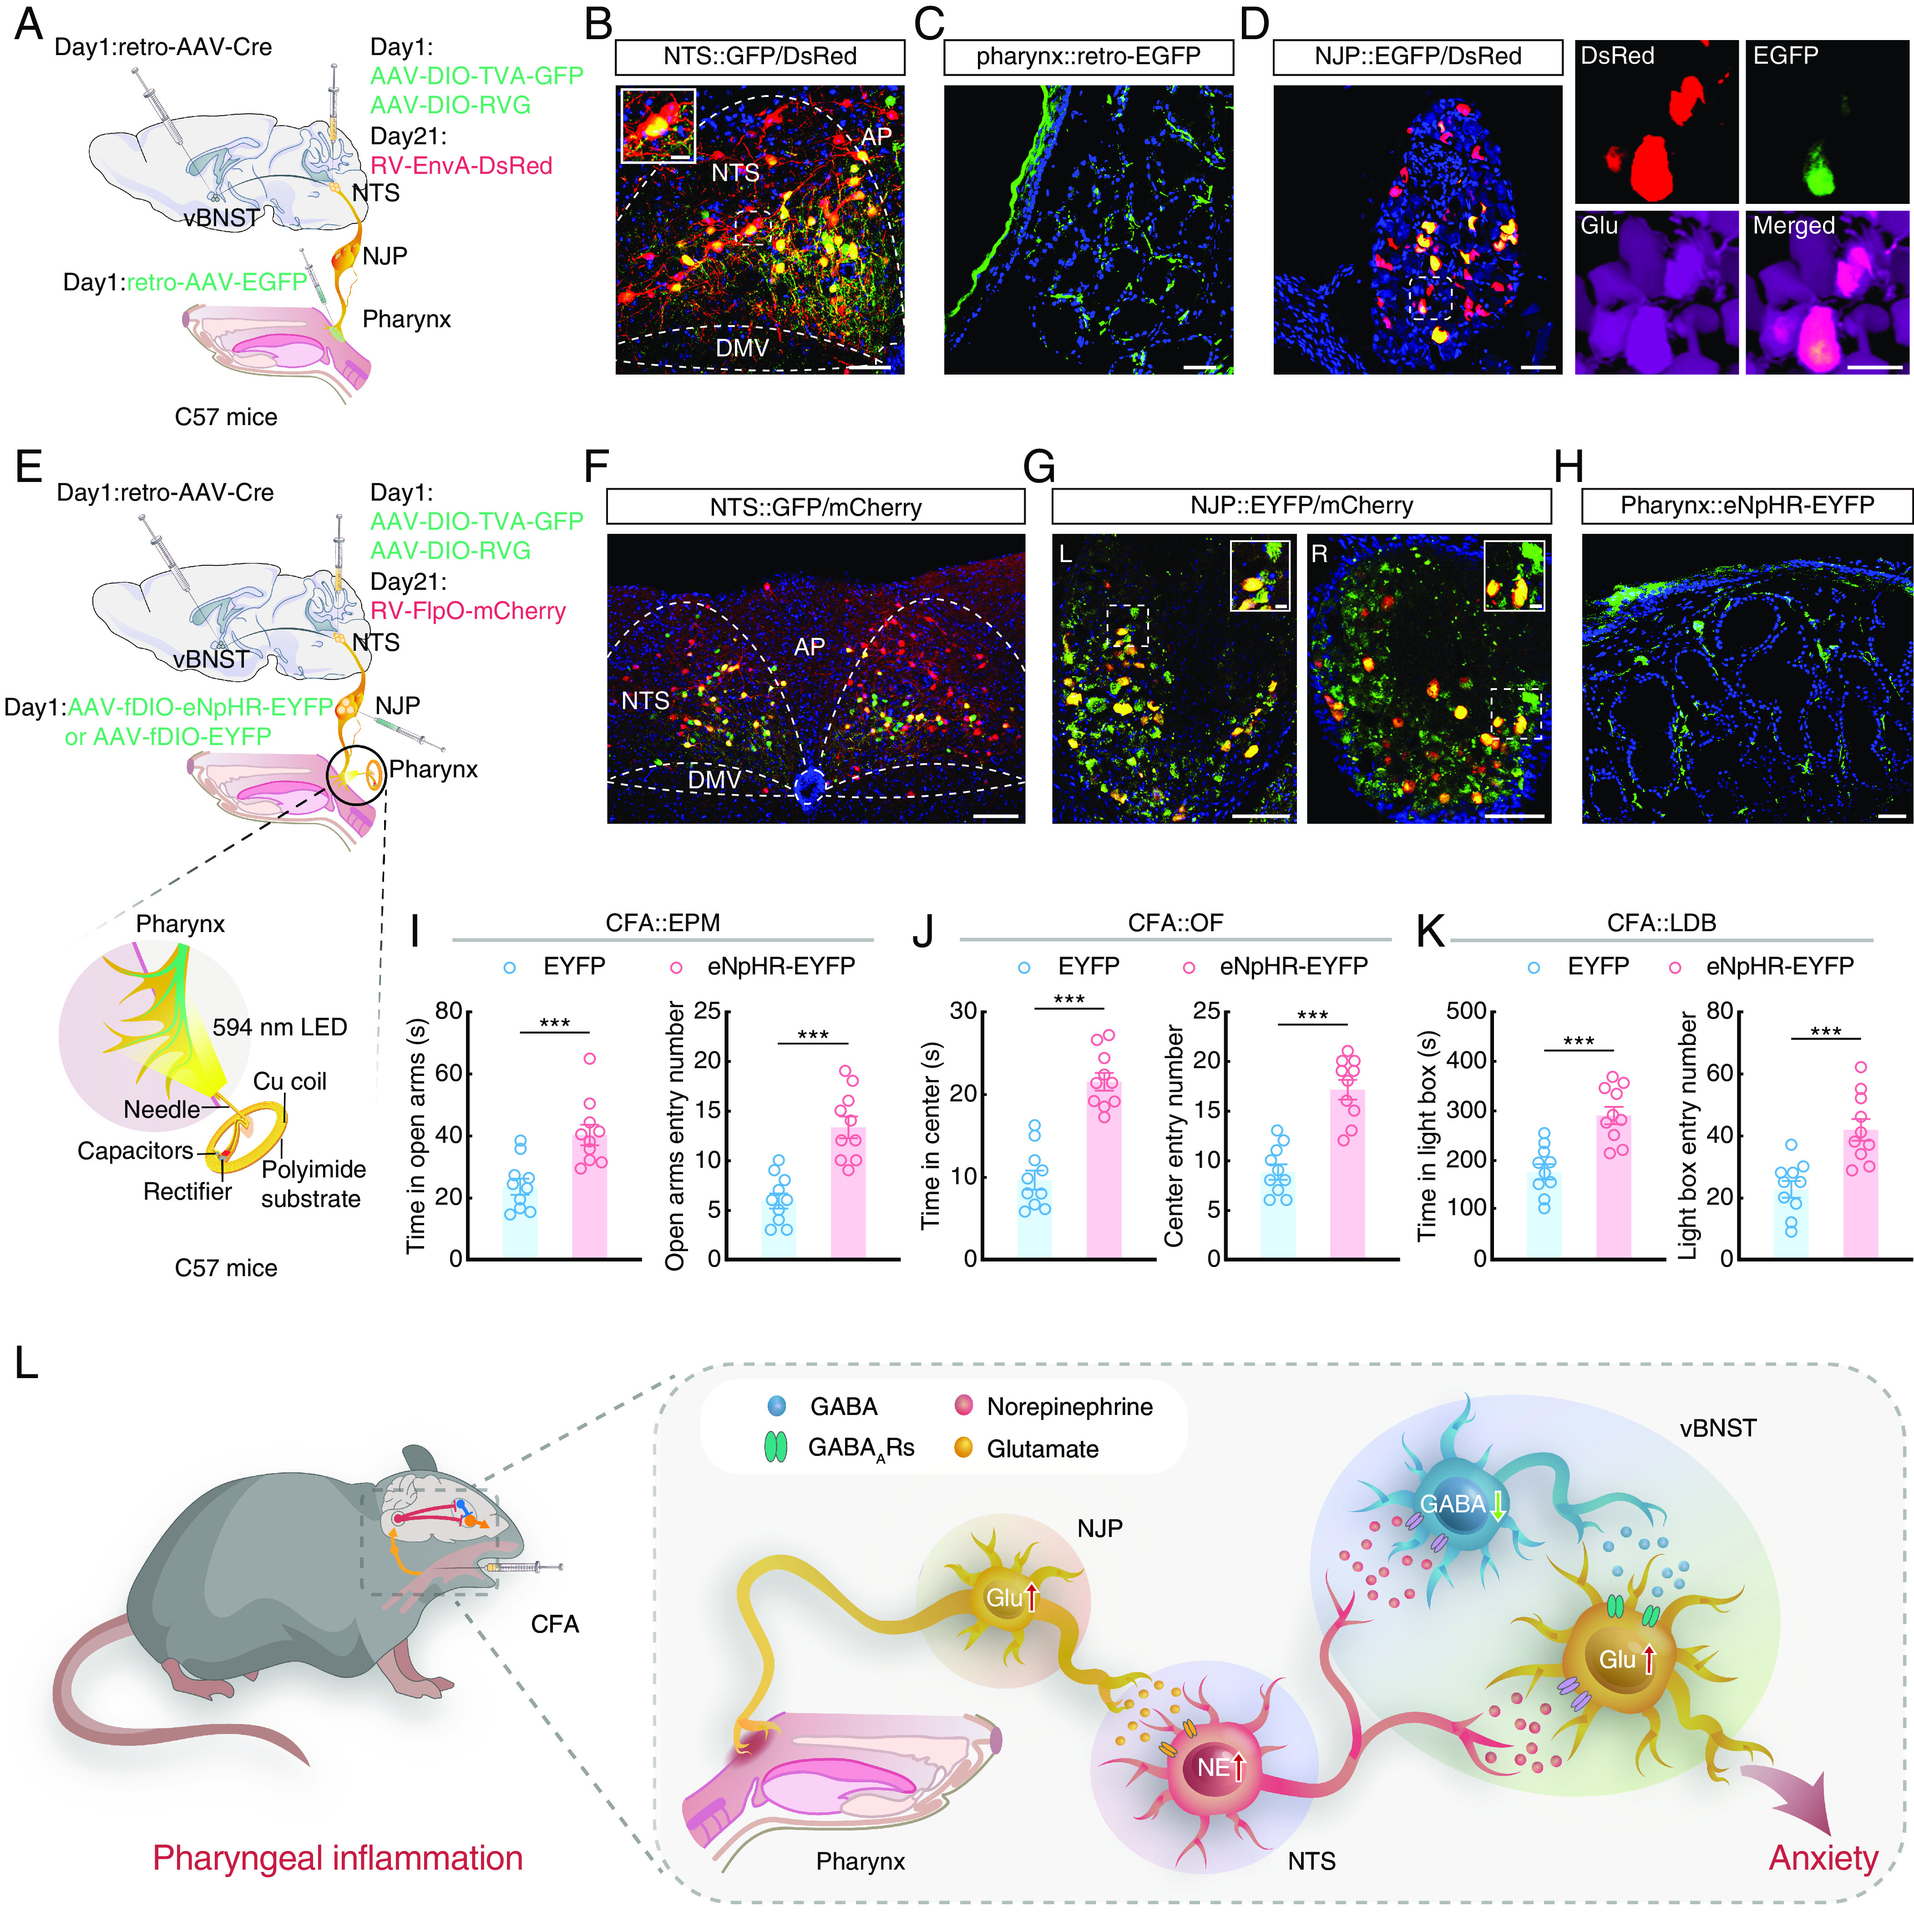
Fig. 6.

Pharyngeal inflammation induces anxiety-like behaviors through a pharynx-to-brain axis in mice. (A) Schematic of the quadruple tracing strategy. (B) Representative images of the starter neurons (yellow) within the NTS. (Scale bar, 50 μm.) The white box depicts the area shown in the box of the NTS. (Scale bar, 10 μm.) (C) Representative image of the infusion site within the pharynx. (Scale bar, 50 μm.) (D) Representative confocal images showing DsRed+ from NTS colabeled with EGFP+ neurons innervating the pharynx (Left). The confocal neurons were colocalized with a glutamate antibody (Right). (Scale bars, 50 μm [Left] or 20 μm [Right].) (E) Schematic of the viral injection and wireless optogenetics. (F) Representative image showing the expression of virus in the NTS. (Scale bar, 100 μm.) (G) Representative images showing the EYFP+ neurons colocalized with mCherry+ in NJP superganglia. (Scale bars, 100 μm.) The white boxes depict the areas shown in the boxes of the NJP superganglia. (Scale bars, 20 μm.) L: Left; R: Right. (H) Representative image showing the projection fibers in the pharynx. (Scale bar, 50 μm.) (I) Summarized data for the EPM test with EYFP and eNpHR-EYFP CFA mice (594 nm light, n = 10 mice per group; Left, t18 = 3.946, P = 0.0009; Right, t18 = 5.526, P < 0.0001). (J) Summarized data for the OF test with EYFP and eNpHR-EYFP CFA mice (594 nm light, n = 10 mice per group; Left, t18 = 7.516, P < 0.0001; Right, t18 = 6.605, P < 0.0001). (K) Summarized data for the LDB test with EYFP and eNpHR-EYFP CFA mice (594 nm light, n = 10 mice per group; Left, t18 = 4.868, P = 0.0001; Right, t18 = 4.347, P = 0.0004). (L) Schematic showing a pharynx-to-brain axis mediating pharyngeal inflammation–induced anxiety. Significance was assessed by two-tailed unpaired Student’s t tests in (I–K). All data are presented as the mean ± SEM. ***P < 0.001.
