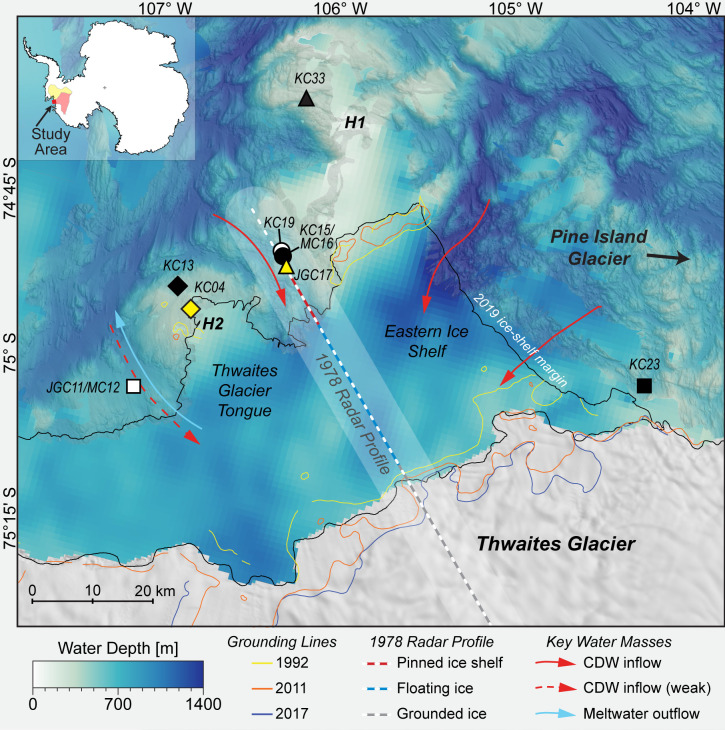
Fig. 1.
Bathymetric map and core locations around the Thwaites Glacier margin. Inset shows location of detailed map (red) and the extent of Thwaites Glacier (pale red) and Pine Island Glacier (pale yellow) catchments. Multibeam bathymetry is compiled from NBP19-02 shipboard data and previous work (15, 30). Lower resolution, satellite-derived bathymetry is shown for sub-ice shelf areas and in places without multibeam bathymetry (31). Two major seafloor highs (H1 and H2) are indicated. REMA digital elevation model shown over grounded ice (32). Approximate grounding-zone locations are shown with lines for years: 1992 C.E. and 2011 C.E. (33); 2017 C.E. (34). Ice-shelf calving margin is from March 2019 C.E. (15). Location of an airborne radar profile collected in 1978 C.E. (dashed line) is also shown with a 10 km wide uncertainty window (13). New core data from NBP19-02 KC04 to KC23 discussed in text. Previous work on cores NBP19-02 KC04, KC23, and NBP20-02 KC33 mentioned in text (25). Red arrows mark CDW flow under the ice shelf, and the light blue arrow illustrates meltwater-enriched outflow (7).

