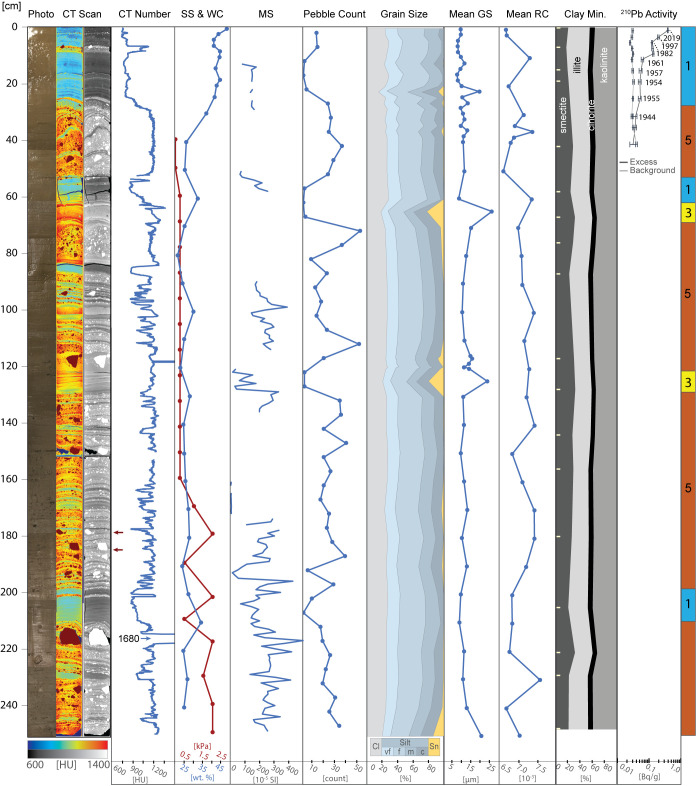
Fig. 2.
Compilation of proxies for core KC04. From left to right: line-scan core image, CT scan images in false color and grayscale (red arrows highlight depressions underneath gravel clasts), CT number, shear strength (SS) and water content (WC), point sensor magnetic susceptibility (MS), pebble count, grain size distribution, mean grain size (GS), mean sand grain roughness coefficient (RC), clay mineral assemblage (sample depths indicated with tick marks), 210Pb activity, and facies assignments, which are defined in Table 1. Point sensor MS was not measured where the opened core surface was uneven. Error bars are shown for individual background and excess 210Pb activity measurements.

