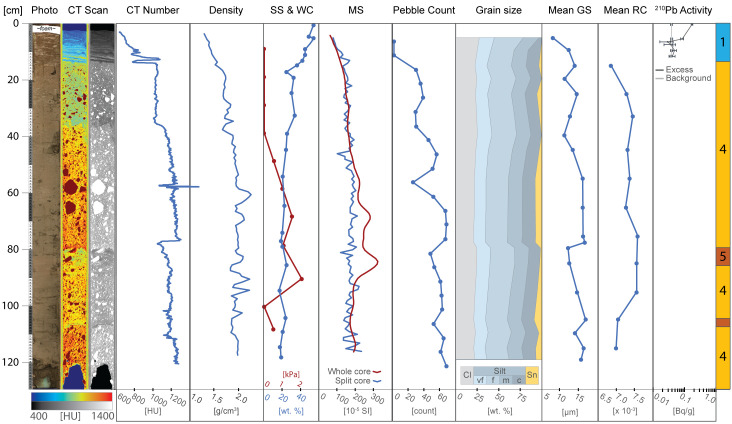
Fig. 3.
Summary of proxy data for core JGC17. From left to right: line-scan core image, CT scan images in false color and grayscale, CT number, density, shear strength (SS) and water content (WC), point-sensor and whole-core magnetic susceptibility (MS), pebble count, grain size distribution, mean grain size (GS), mean sand grain roughness coefficient (RC), 210Pb activity, and facies assignments, which are defined in Table 1. Error bars are shown for individual background and excess 210Pb activity measurements

