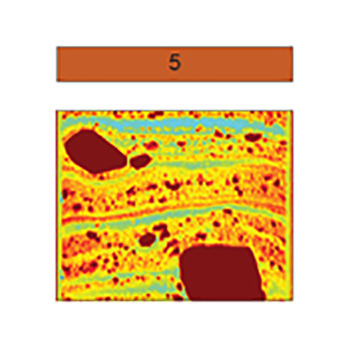
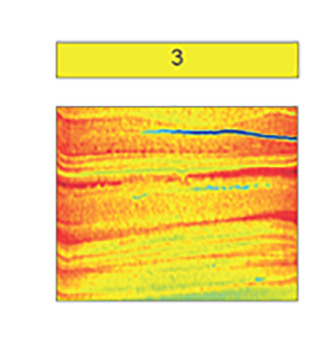
Table 1.
Summary of proxy data for sediment Facies 1 to 5
|
|
|
|
|
|
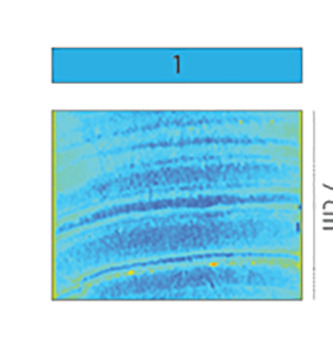
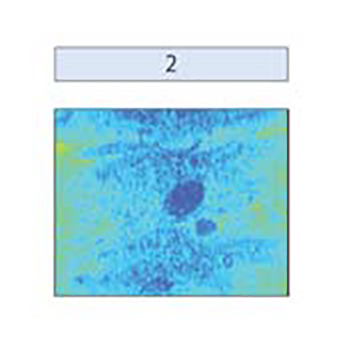
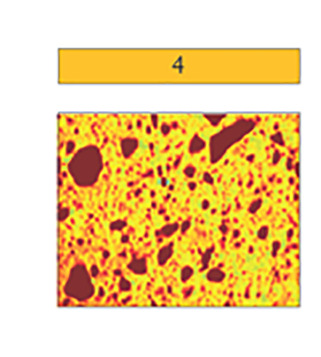
| Laminated clayey silt with sandy lenses and isolated gravel | Mottled to weakly laminated clayey silt | Laminated sandy mud | Massive diamicton | Stratified diamicton with Facies 1,3 interbeds | |
| Microfossils | foraminifera, diatoms | foraminifera, diatoms | foraminifera | none | foraminifera |
| Mean [μm] | 7–11 | 6–8 | 17–48 | 11–45 | 10–21 |
| Clay [%] | 22–28 | 23–32 | 12–22 | 14–27 | 18–26 |
| Silt [%] | 72–77 | 68–75 | 18–68 | 66–75 | 65–76 |
| Sand [%] | 0–7 | 0–3 | 9–42 | 3–38 | 1–16 |
| Pebbles [per 5 cm depth] | 0–15 | 0–5 | none | 14–66 | 16–60 |
| Roughness [x 1−3] | 6.6–7.5 | 5.7–7.7 | 6.9–7.4 | 6.8–7.6 | 6.5–7.8 |
| WC [wt. %] | >30 | >35 | 26–37 | 10–25 | 18–27 |
| SS [kPa] | ≤2 | ≤3 | 0 | ≤24.5 | ≤2 |
| MS [10−5 SI] | 100–200 | 100–150 | 100–250 | 50–800 | 125–500 |
| CT Num. [HU] | 700–950 | 800–900 | ≥ 1,000 | 1,000–1,450 | 900–1,200 |
| Setting(s) | Open marine to distal sub-ice shelf | Bioturbated open marine to distal sub-ice shelf | Open marine to distal sub-ice shelf (higher energy/closer source) | Ice proximal | Proximal to pinned ice shelf |
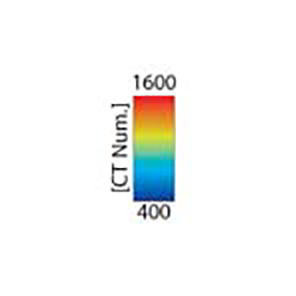
Example CT scan images shown in color; CT number values are indicated with color bar. Abbreviations: water content (WC), shear strength (SS), and magnetic susceptibility (MS).
