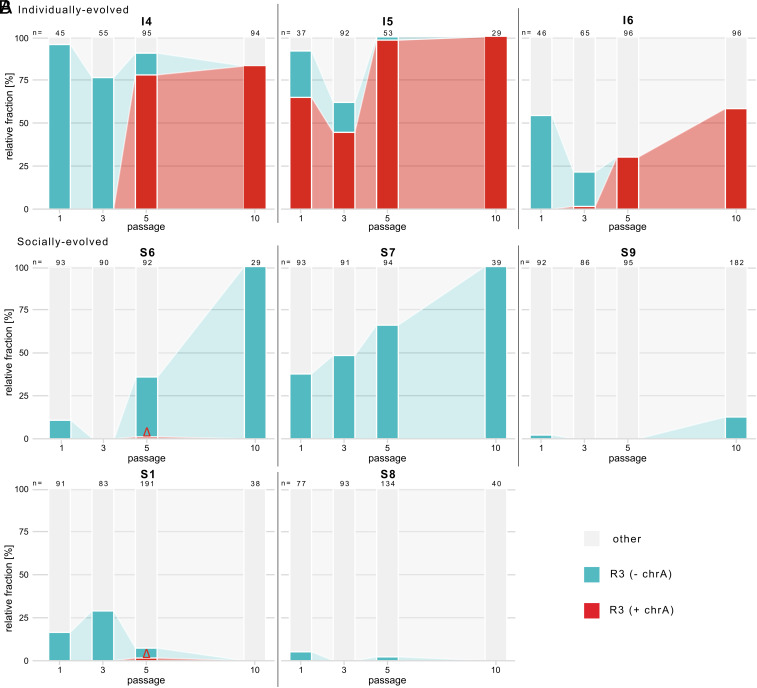
Fig. 2.
Comparative dynamics of R3 spores with either chrA present or absent over the course of the selection experiment. Proportion of R3 spores with chrA present (red) or absent (turquoise) in comparison to the remaining strains (gray) analyzed in passages 1, 3, 5, and 10 in (A) individual ant hosts (I4, I5, I6) or (B) ants with nestmates providing sanitary care [Upper row: replicate lines, in which R3 persisted until passage 10 (S6, S7, S9); Lower row: replicate lines, in which R3 still persisted in passage 5, but was outcompeted until passage 10 (S1, S8)]. The value of n represents the total number of genotyped single-spore derived colonies (n = total of 2,626 spores). Please note that the occurrence of chrA in R3 in two of the socially evolved replicate lines, where it later failed to establish, is highlighted by a red triangle.

