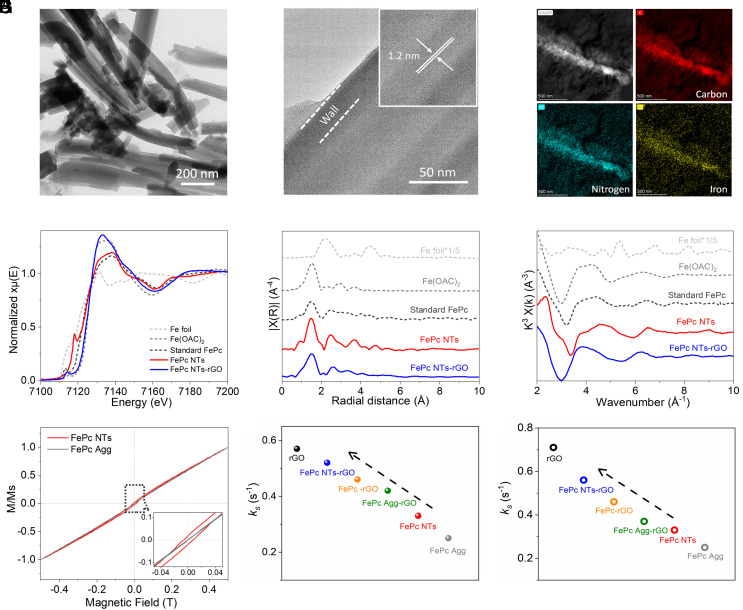
Fig. 1.
Low (A) and high (B) resolution TEM images of FePc NTs. (C) Typical dark-field TEM image of FePc NTs-rGO with the corresponding elemental mapping images by EDX analysis. (D) Fe K-edge XANES data of FePc NTs and FePc NTs-rGO, and the data of Fe foil, Fe(OAc)2 and FePc standards are included for comparison. Corresponding Fourier transformed EXAFS data in R-space (E) and k-space (F). (G) SQUID magnetizations of FePc NTs and FePc Agg conducted at 5 K. Inset shows a zoom on the central region. Kinetic constants of interfacial electron transfer on various samples probed using 1 mM Ru (NH3)6Cl3/0.1 M KCl (H) and 1 mM K3Fe(CN)6/0.1 M KCl (I).

