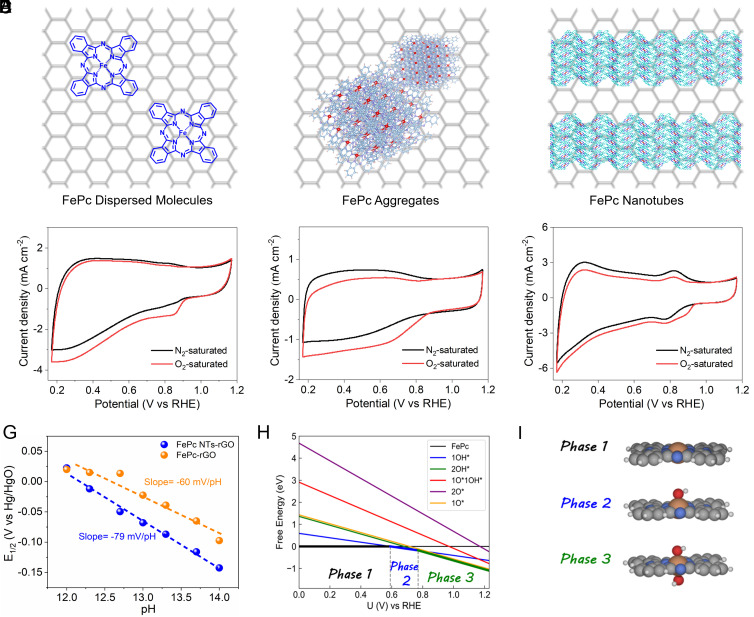
Fig. 3.
Schemes show the morphologies of FePc-rGO (A), FePc Agg-rGO (B), and FePc NTs-rGO (C). Corresponding CVs of FePc-rGO (D), FePc Agg-rGO (E), and FePc NTs-rGO (F) conducted in N2/O2 saturated 0.1 M KOH, respectively, 50 mV s−1. (G) Pourbaix diagram of FePc-rGO and FePc NTs-rGO for the redox of Fe centers. (H) Surface phase diagram of FePc as a function of applied potentials. (I) Geometrical structures of three most stable phases of FePc.

