Fig. 2.
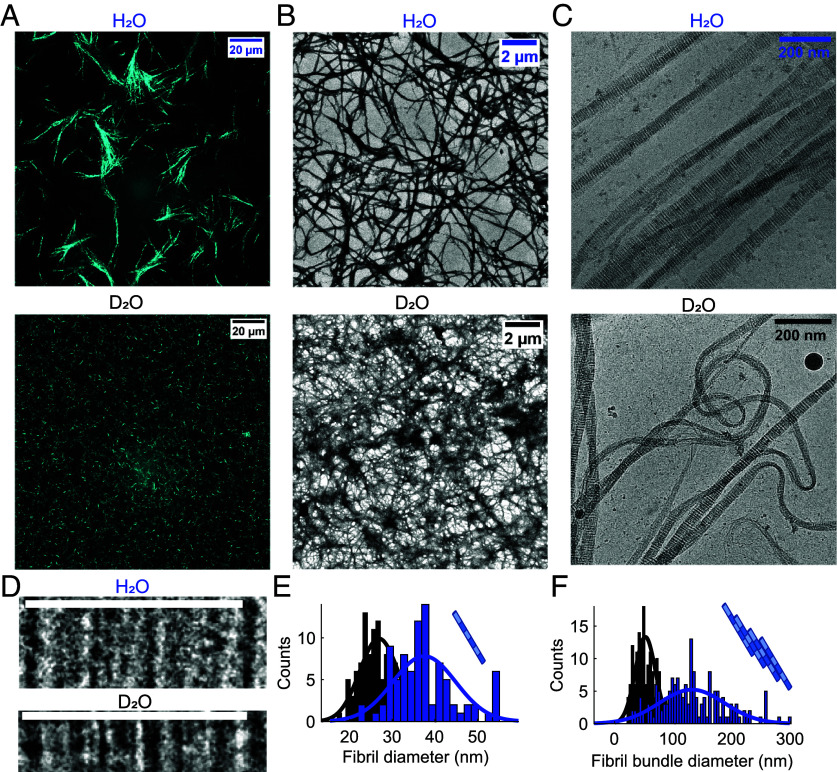
Differences in the collagen fibril and network structures in H2O and D2O. (A) Representative CRM images of the collagen network formed in water and heavy water at a concentration of 1 mg/ml. (B and C) Representative TEM and cryo-TEM images of the collagen network formed in water and heavy water at a concentration of 1 to 1.25 mg/ml. (D) cryo-TEM Images of single fibrils (Top, scale bar corresponds to 67.5 nm). (E) Distribution of the fibril thickness in H2O and D2O as calculated from cryo-TEM images. (F) Distribution of the fibril bundle thickness (i.e., fibers) in H2O and D2O as calculated from TEM images.

