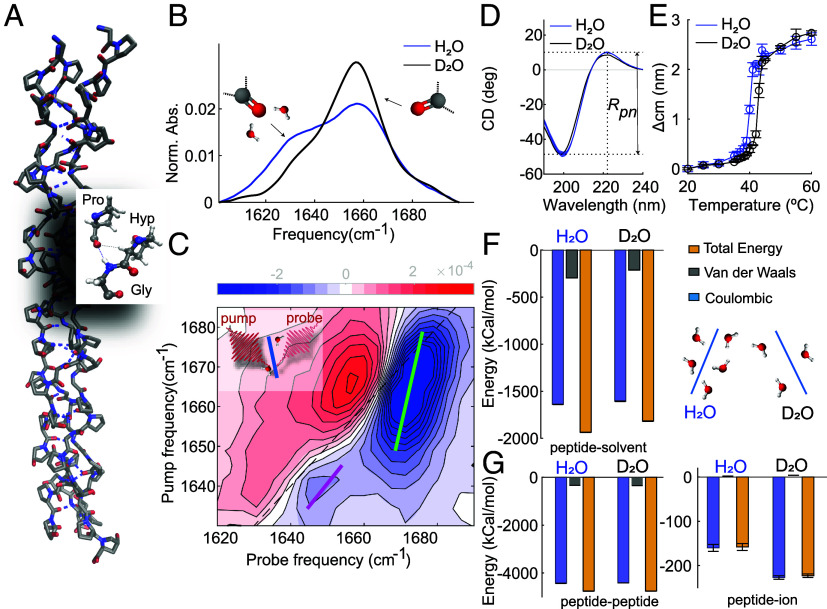
Fig. 3.
Collagen is less hydrated in D2O than in H2O, but retains the same helicity. (A) Crystal structure of the (Gly-Pro-Hyp) nonamer PDB ID: 3B0S(33). (B) IR spectra of heavy water and water solutions containing Type I full-length collagen at a concentration of 2 mg/ml and 10 mg/ml, respectively, recorded at 23°C. Full IR spectra are shown in SI Appendix, Fig. S3. The IR spectrum in D2O was obtained using FTIR in transmission mode, in H2O it was obtained by using FTIR in reflection mode (ATR-FTIR). In the latter case, because of the shorter optical path length, we used a higher collagen concentration to obtain a sufficient signal-to-noise ratio. The IR spectrum of collagen in water is not concentration dependent (ref. 34 and SI Appendix, Fig. S4). (C) 2D–IR spectrum of a heavy water solution containing Type I full-length collagen at a concentration of 2 mg/ml recorded at a waiting time between pump and probe pulses of 1 ps. The blue contours represent a decrease in absorption (A 0) due to depletion of the = 0 state, and the red contours an increase in absorption (A 0) due to the induced absorption of the v = 1 2 transition. Colored lines in the 2D-IR spectrum represent the calculated central lines (See SI Appendix for more details). (D and E). CD spectra and melting curves extracted from temperature-dependent CD measurements of Type I full-length collagen dissolved in water and heavy water at a concentration of 0.1 mg/ml, respectively (see SI Appendix for more details). (F) Interaction energies between the peptide and the solvent (D2O, H2O) molecules and schematic of collagen hydration in D2O and H2O. (G) Intramolecular energies and energies between the peptide and the ions in D2O and H2O.

