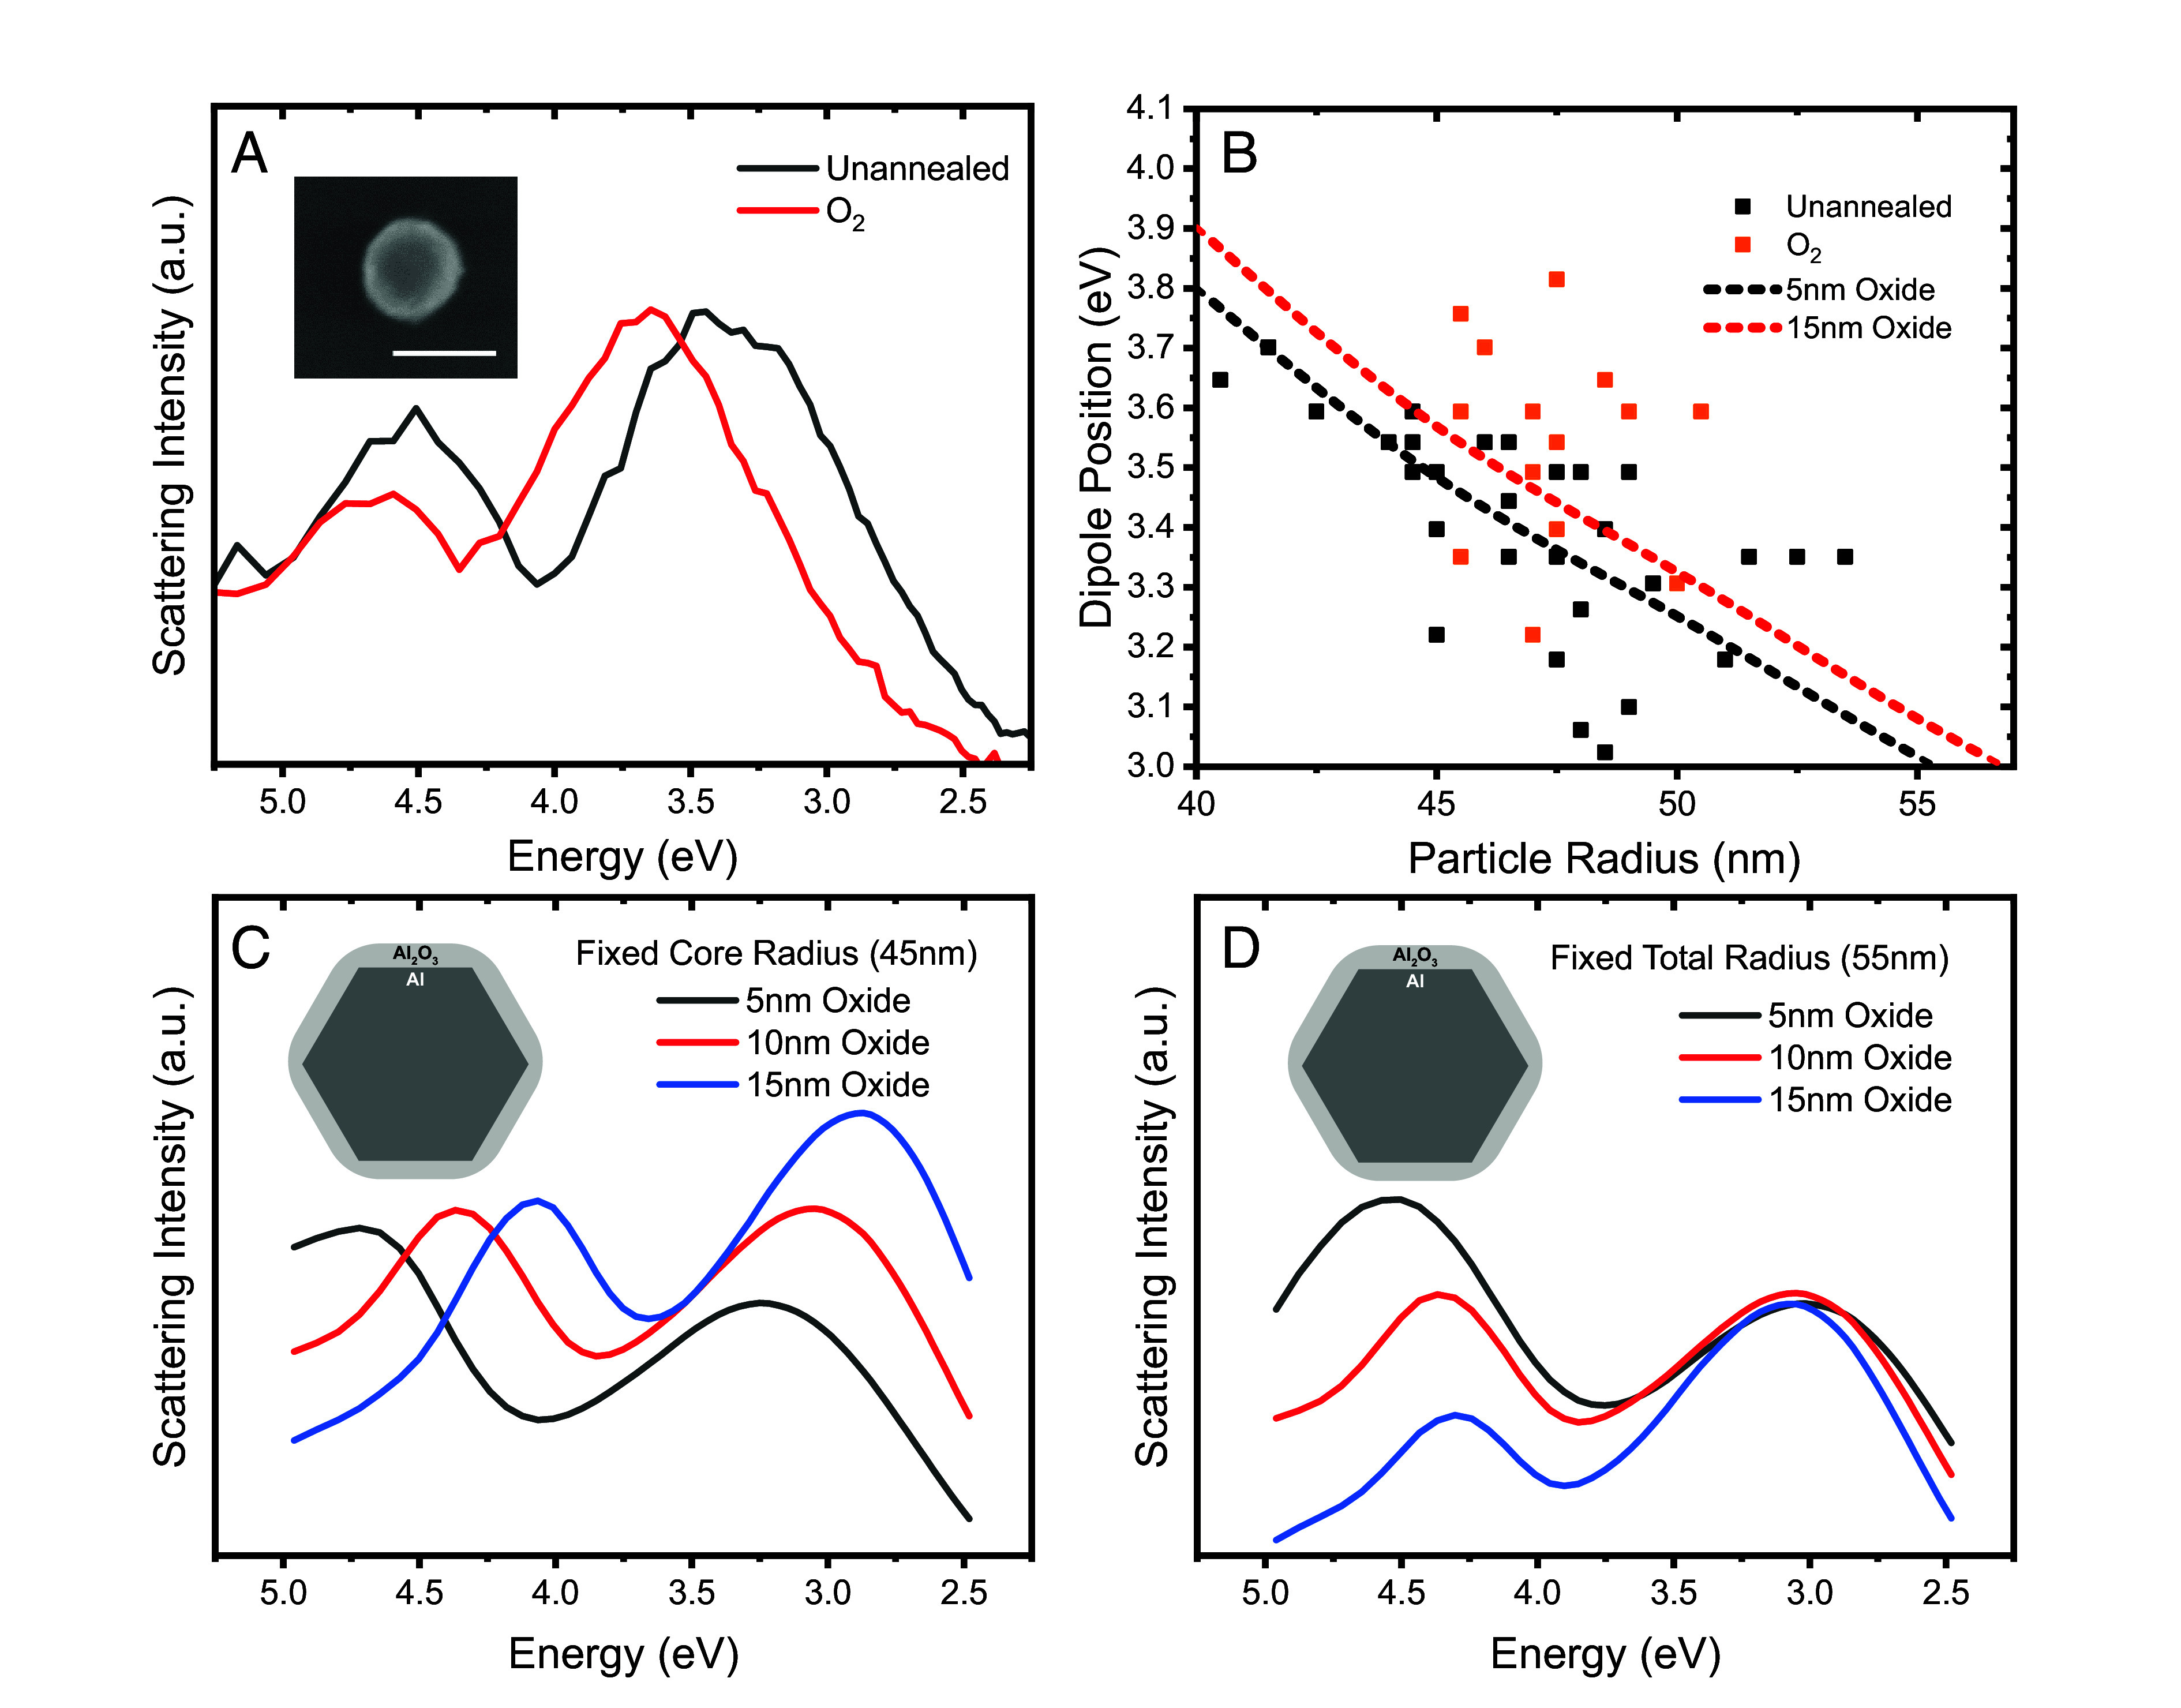
Fig. 3.

Plasmonic properties of individual AlNCs before and after O2 annealing. (A) Experimental single-particle scattering spectra of an AlNC before and after O2-annealing. (Inset) Scanning electron microscope image of the AlNC after annealing. The scale bar is 100 nm. (B) Plot of measured AlNC diameters and corresponding dipole peak positions for a cohort of annealed and unannealed AlNCs. Dashed lines represent the calculated dipolar plasmon energies for AlNCs with a fixed 5-nm (black) or 15-nm (red) surface oxide layer. (C) Calculated dark-field spectra of a 45-nm fixed radius AlNC core with changing shell thicknesses. (D) Calculated dark-field spectra of a 55-nm total radius AlNC with changing core radii and oxide layer thicknesses. (C and D, Inset) Schematic of theoretical model for AlNC.
