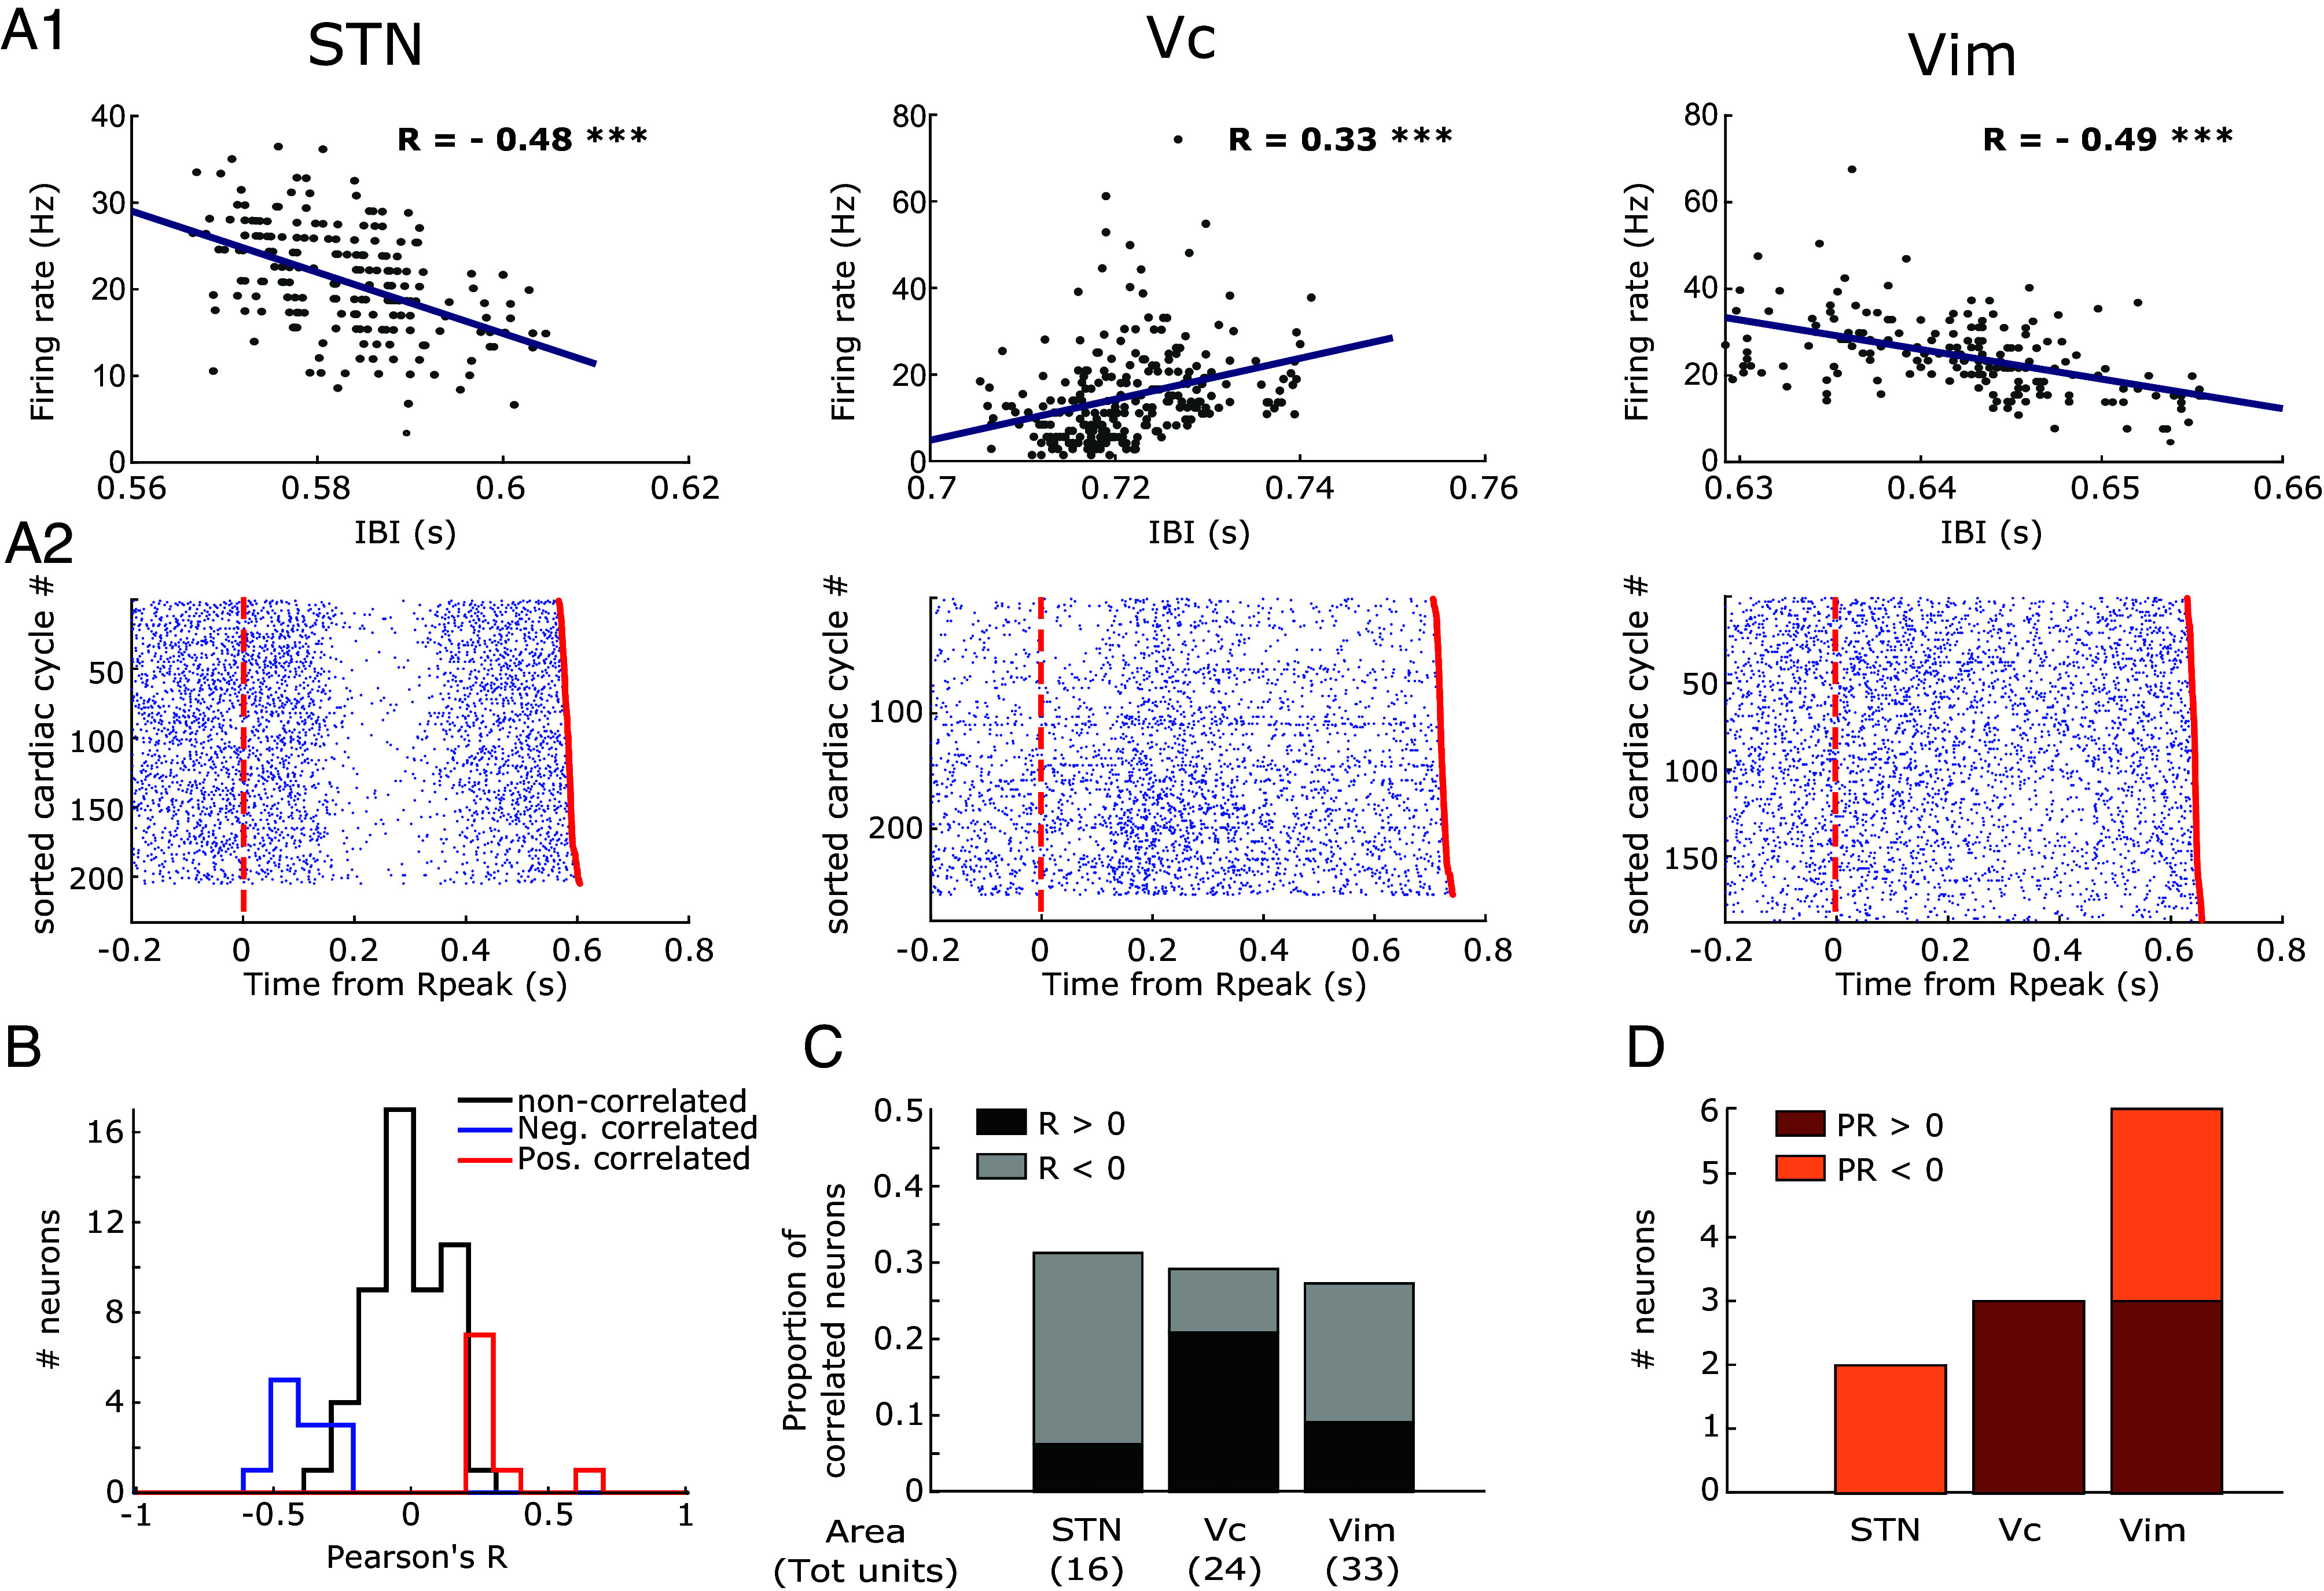
Fig. 3.

Neural activity covaries with Inter-Beat Interval. (A1) Correlation between the duration of the cardiac cycle (IBI) and the firing rate across cycles in three exemplary neurons recorded from the three different target regions (STN, Vc, and Vim). Pearson’s R is reported for each plot. Asterisks mark correlation significance (*** indicate P < 0.001). (A2) Raster plots from the three exemplary neurons of the neural spikes aligned to the R-peak across the different cardiac cycles where cycles were sorted according to their IBI. The red dotted line represents the beginning of the cardiac cycle (R-peak) while the red dot at the end of each trial represents the following R peak. (B) Distributions of Pearson’s R values for the correlation between IBI and firing rates separated in un-correlated (black), and significantly correlated (blue for R < 0, red for R > 0). (C) Proportion of recorded neurons exhibiting a significant positive (dark gray) or negative (light gray) correlation between IBI and firing rate in the three regions. The total number of neurons tested in each region is shown in parentheses. (D) Number of recorded neurons in the three regions for which a significant phase-response (PR) of IBI to neural activity was detected. Bars are colored according to the sign of the detected PR (dark orange for positive, light orange for negative).
