Fig. 5.

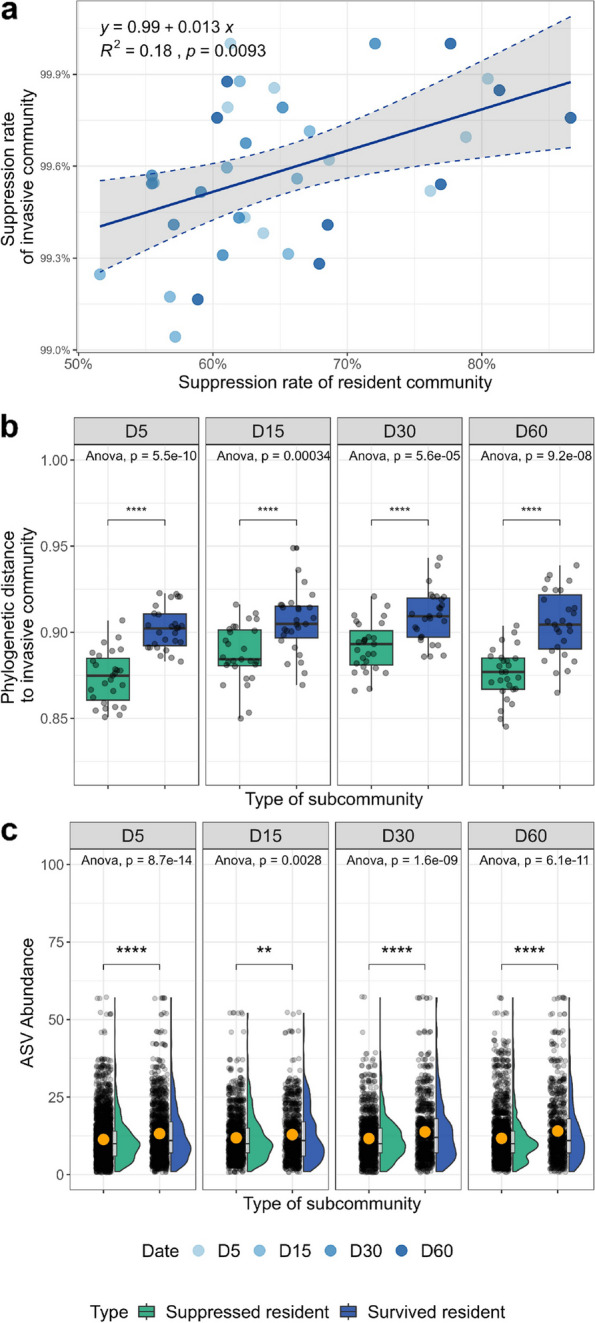
Survival strategies of resident taxa. a Relationship between the suppression rate of residents and invaders after coalescences. The suppression rate of invaders is the opposite of the survival rate of invasive communities. The suppression rate of the resident community and the survival rate of the invasive community were described in Fig. 3. b Phylogenetic distance between the invasive community and the suppressed or survived components (sub-community) of the resident communities after community coalescences. c The abundance (number of reads of each ASV) of the suppressed or survived resident subcommunities. An orange dot indicates the mean value. One-way ANOVA and p value indicate the global variance among groups. Asterisks above the dots indicate the significant difference (“ns”, p > 0.05, “*”, p < 0.05, “**”, p < 0.01, “***”, p < 0.001, “****”, p < 0.0001; t-test)
