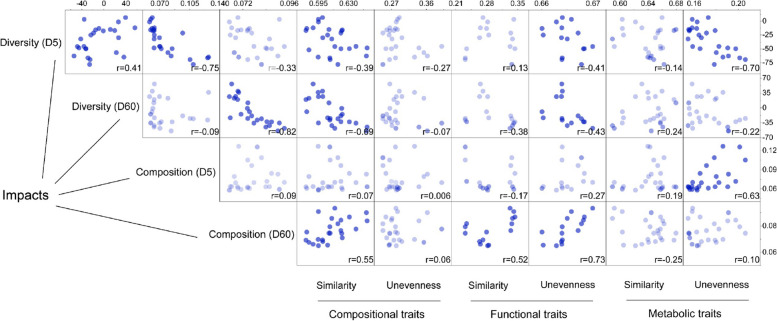
Fig. 7.
Multi-level traits of invasive communities predict invasion impacts. Pearson’s correlation matrix showing similarity and unevenness indexes of invasive communities predicting the invasion impact (change ratio (%) of richness and compositional dissimilarity in relation to uninvaded control) of coalescent communities at days 5 (D5) and 60 (D60). Points in darker colors indicate a significant correlation (p < 0.05). The compositional similarity (n = 27) was calculated based on the weighted UniFrac distance between invasive and resident communities at day 0. Functional (CAZy genes, n = 15) and metabolic (utilization of 71 C sources, n = 27) similarities were based on Bray-Curtis similarity between invasive and resident communities at day 0. Unevenness indexes of invasive communities were calculated as Strong’s dominance index. Treatment E-C was excluded as the outlier from this analysis because of the higher metabolic unevenness than other treatments

