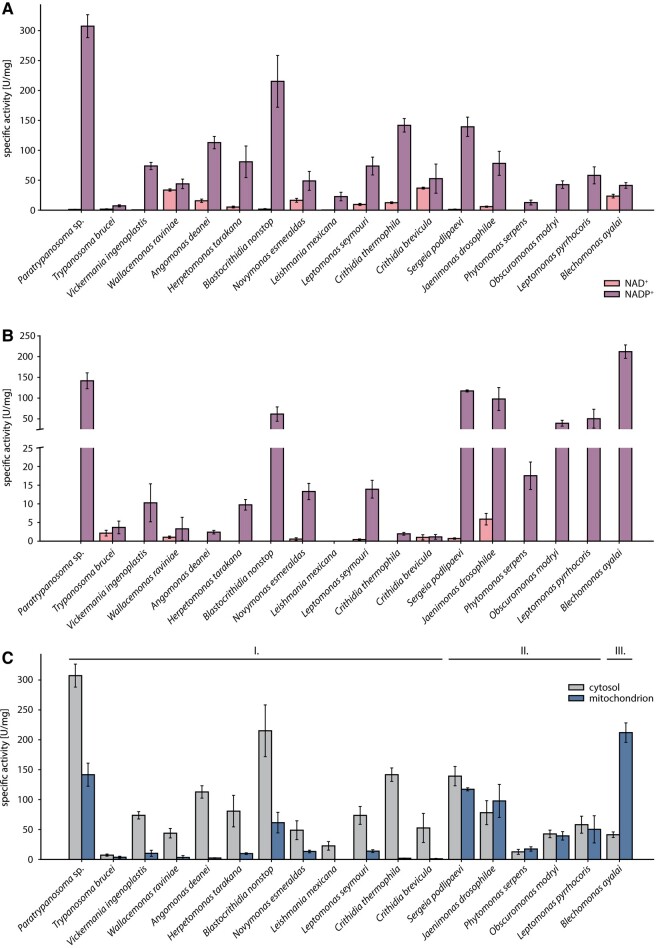
Fig. 3.
IDH cofactor specificity and activity distribution. Specific IDH activity in A) cytosolic and B) mitochondrial fraction with NAD+ and NADP+ cofactors. C) Comparison of NADP+-dependent IDH activity between cytosol and mitochondrion. Groups I, II, and III refer to species with elevated NADPH generation in cytosol (labeled I.), similar production of NADPH in both compartments (labeled II.), and elevated NADPH generation in mitochondrion (labeled III.). 1 U = nmol of NADH/NADPH per min per milligram of total protein.

