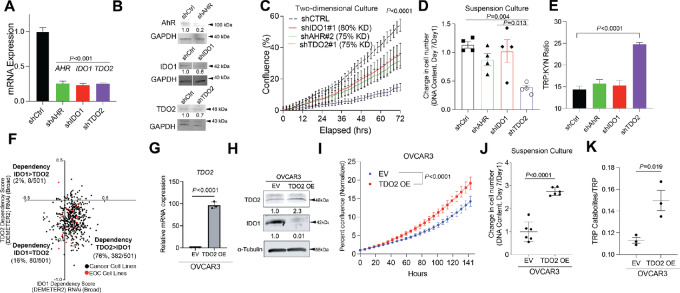
FIGURE 2.
Ovarian cancer cells depend more on TDO2 than IDO1 in TRP catabolism pathway. A, qRT-PCR validation of OVCAR3 knockdown cells. Internal control, 18S. B, Immunoblot of respective knockdowns. Loading control, GAPDH. C, Cell confluence imaged for 72 hours. D, Cells cultured in suspension for 7 days. DNA content was measured on days 1 and 7. E, TRP and KYN levels in conditioned media from shCtrl and shKD cells over 24 hours via mass spectrometry. F, DepMap data (The Broad Institute) from 551 cancer cell lines. TDO2 (y-axis) and IDO1 (x-axis) dependency scores. Red dots represent EOC cell lines. Black dots represent all other cancer cell lines. G, EV and TDO2 OE vector transduced into OVCAR3 cells. G, qRT-PCR of TDO2. Internal control, 18S. H, Immunoblot of OVCAR3 EV and TDO2 OE. Loading control, alpha-tubulin. I, Incucyte 2D proliferation assay. J, 3D proliferation assay. K, TRP catabolites in OVCAR3 EV and TDO2 OE cells. Statistical test, unpaired t test (A, G, J), mixed-model effect (C, I), multicomparison two-way ANOVA (D, E).

