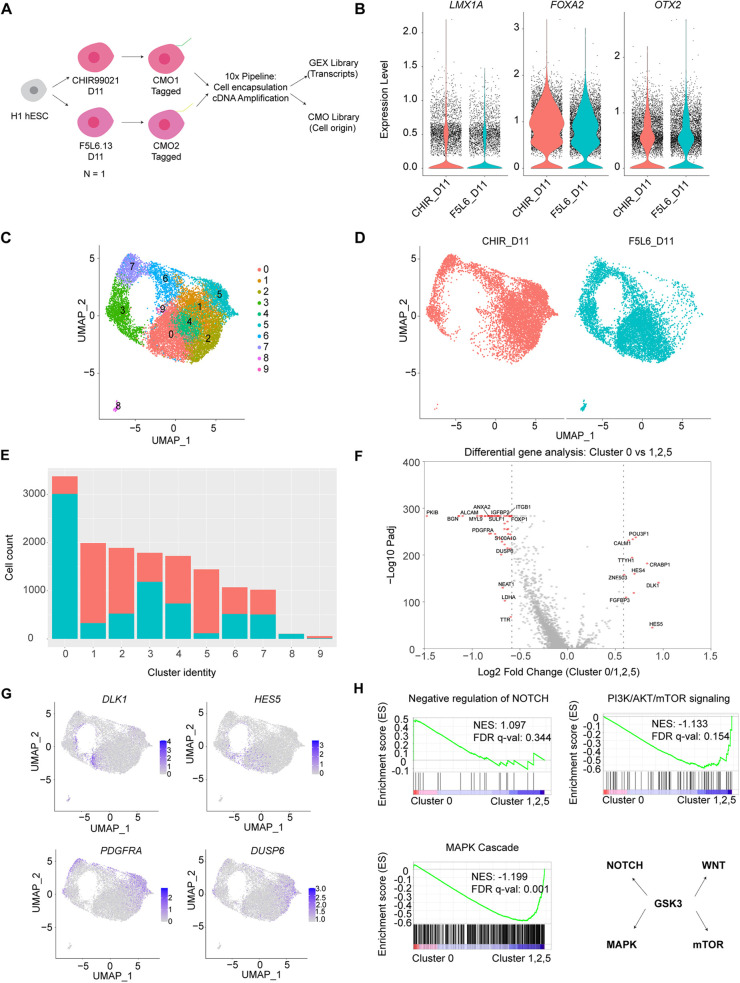
Fig. 5.
scRNA sequencing of day 11 VM progenitors patterned by F5L6.13 and CHIR99021. (A) Schematic of the workflow in 10x Cellplex pipeline labelling the differentiated cells with CMOS for barcoding before sample processing and sequencing. This experiment was performed using one biological replicate in parallel. (B) Violin plots displaying distribution of expression levels of LMX1A, FOXA2 and OTX2 across all cells. (C) UMAP plot showing clustering of single cells from both treatment conditions. (D) UMAP plot showing the cell identity of treatment conditions contributing the clusters. (E) Bar plot showing the number of cells from each treatment condition contributing to each cluster. (F) Volcano plots of differentially expressed genes comparing cluster 0 versus cluster 1, 2 and 5. Each dot represents a gene. Red dots represent significantly regulated genes with fold change>1.5. (G) Normalized expression levels of indicated genes that were identified in the analysis superimposed onto the UMAPs. Data are colored according to expression levels in each cell. (H) Enrichment of pathways identified using GSEA with a curated ranked gene list from differential expression analysis comparing cluster 0 with clusters 1, 2 and 5. NES and FDR q-values are indicated in the pathway. Bottom right panel indicates the pleiotropic effect of GSK3 in the signaling pathways.

