Fig. 6.
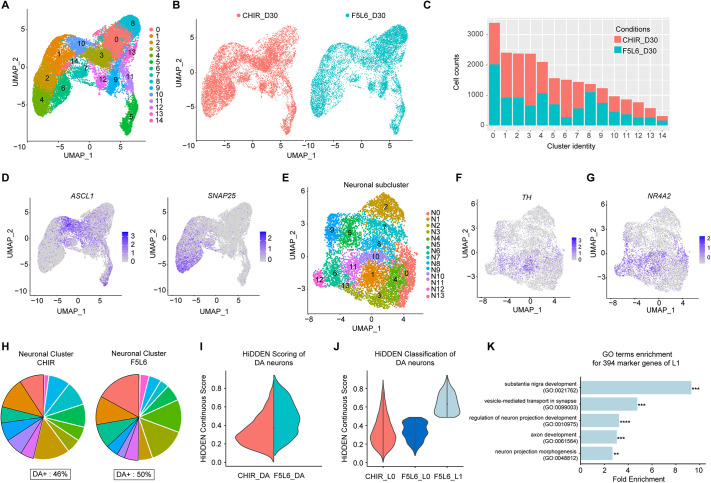
scRNA sequencing of day 30 VM neuronal population patterned by F5L6.13 and CHIR99021. (A) UMAP plot showing clustering of the day 30 single cells from one biological replicate. (B) UMAP plot showing the cell identity of treatment conditions (CHIR99021 or F5L6.13) contributing the clusters. (C) Bar plot showing the number of cells from each treatment condition contributing to each cluster. (D) Normalized expression levels of ASCL1 and SNAP25 superimposed onto the UMAPs. Data are colored according to scaled expression in each cell. (E) UMAP plot showing subclustered neuronal population. (F,G) Normalized expression levels of TH (F) and NR4A2 (G) superimposed onto the neuronal subclustered UMAP. Data are colored according to expression levels in each cell. (H) Pie chart displaying the proportion of neuronal subclusters contributed from each treatment condition with the DA+ clusters highlighted. The percentage of DA+ cluster in each condition is indicated. (I) HiDDEN continuous scoring of the DA neuronal population in CHIR and F5L6.13 conditions. (J) Classification of the DA subpopulation from the continuous score generated from HiDDEN. (K) Gene ontology enrichment analysis of the 394 marker genes of the F5L6_L1 subpopulation. **P<0.01, ***P<0.001, ****P<0.0001 (Fisher's Exact test).

