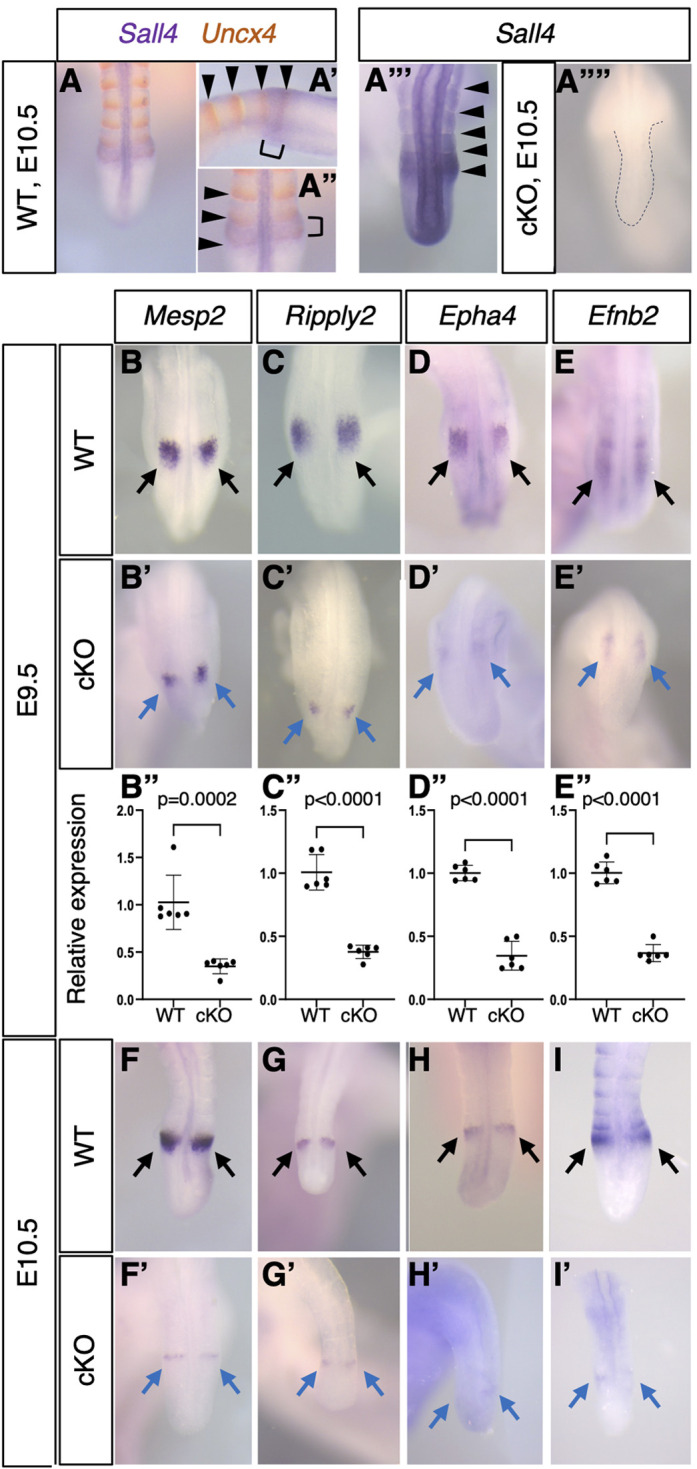
Fig. 1.

Gene expression patterns in the anterior part of PSM. (A-A″) Double color in situ hybridization of Uncx4 (orange) and Sall4 (purple) at E10.5 (n=3). The Sall4 detection reaction was stopped early to visualize a strong expression domain. A and A″ show dorsal views; A′ shows a lateral view. A′ and A″ show a more-detailed view of the somite-PSM boundary region in A. Arrowheads in A′ and A″ indicate the Uncx4 expression domain. Brackets in A′ and A″ indicate the next somite-forming region at the anterior PSM. (A‴,A⁗) Sall4 in situ hybridization in WT (A‴, n>30) and Sall4 cKO (A⁗, n=3) embryos at E10.5. Arrowheads in A‴ indicate the Sall4 expression domain. The dotted line in A⁗ depicts the tail morphology. (B-E′,F-I′) Expression pattern of Mesp2 [B (n=6), B′ (n=4), F (n=5), F′(n=3)], Ripply2 [C (n=6), C′ (n=5), G (n=6), G′ (n=6)], Epha4 [D (n=6), D′ (n=4), H (n=6), H′ (n=5)] and Efnb2 [E (n=6), E′ (n=4), I (n=6), I′ (n=4)] at E9.5 (B-E′) and E10.5 (F-I′). B-E and F-I show dorsal views of the posterior part of the body or tail in wild-type embryos. B′-E′ and F′-I′ show equivalent regions in Sall4 cKO embryos. Black and blue arrows indicate normal expression in wild type and reduced expression in mutants, respectively. B-E′ and F-I′ are at the same scale. (B″-E″) Relative expression levels of Mesp2 (B″), Ripply2 (C″), Epha4 (D″) and Efnb2 (E″) in the posterior trunk of wild-type and Sall4 cKO embryos at E9.5. Each dot represents an embryo. P values were obtained using an unpaired t-test.
