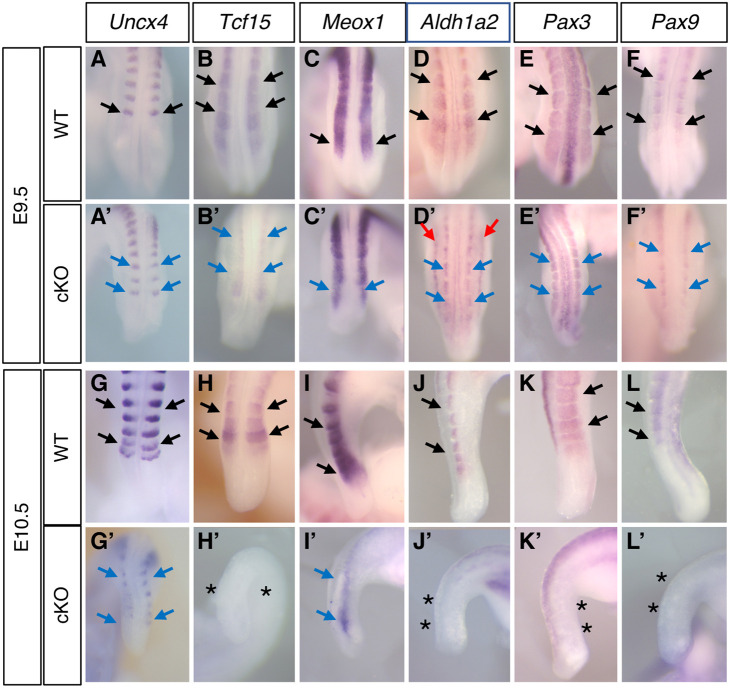
Fig. 3.
Gene expression patterns in the somites. (A-L′) Expression patterns of Uncx4 [A (n=6), A′ (n=3), G (n=6), G′ (n=4)], Tcf15 [B (n=6), B′ (n=5), H (n=6), H′ (n=4)], Meox1 [C (n=4), C′ (n=4), I (n=4), I′ (n=3)], Aldh1a2 [D (n=4), D′ (n=3), J (n=4), J′ (n=3)], Pax3 [E (n=4), E′ (n=3), K (n=4), K′ (n=4)] and Pax9 [F (n=4), F′ (n=3), L (n=4), L′ (n=3)] at E9.5 (A-F′) and E10.5 (G-L′). I-L and I′-L′ show lateral views; all other panels show dorsal views. Black and blue arrows indicate normal expression in wild type (black) and reduced expression in mutants, respectively. Red arrows in D′ indicate ectopic expression of Aldh1a2 in Sall4 cKO embryos. A-F′ and G-L′ are at the same scale. Asterisks indicate lack of expression.

