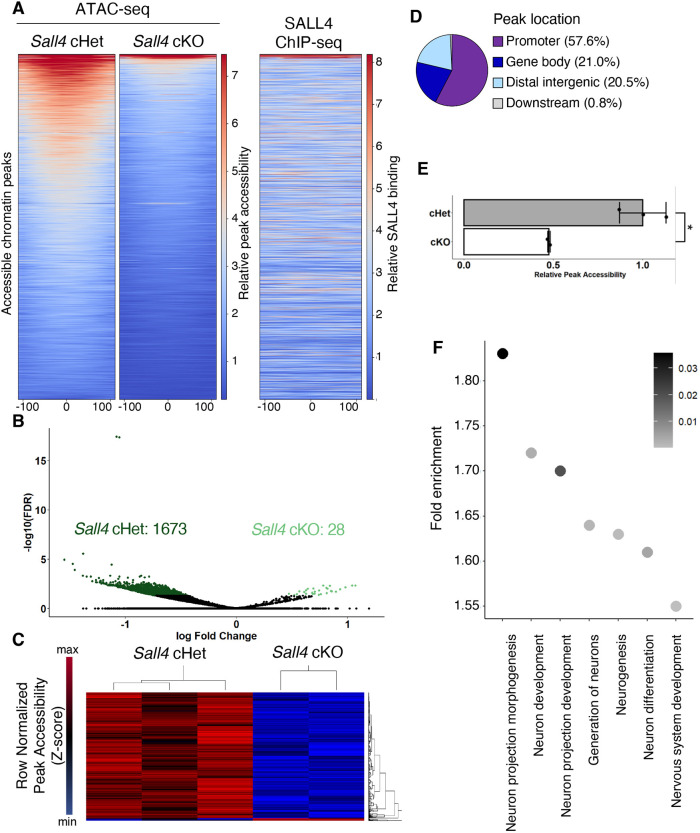
Fig. 4.
Chromatin accessibility of mesoderm-enriched tissue from the posterior trunk. (A) Heatmap showing genome-wide accessibility in Sall4 cHet and Sall4 cKO samples, and SALL4 enrichment in the same genomic intervals. The x-axis corresponds to ±100 base pairs from the center of accessible regions (shown as 0). (B) Volcano plot showing differentially accessible genomic intervals between Sall4 cHet and Sall4 cKO samples. (C) Heatmap of the 1701 genomic intervals that showed differential accessibility between Sall4 cHet and Sall4 cKO samples. (D) A pie chart showing distribution of differentially accessible regions. (E) A bar graph showing relative accessibility score between Sall4 cHet and Sall4 cKO samples. *P=0.0186 (Welch′s two-sample t-test). (F) A dot plot showing enriched GOs related to neural development and functions. Gray shading indicates FDR.

