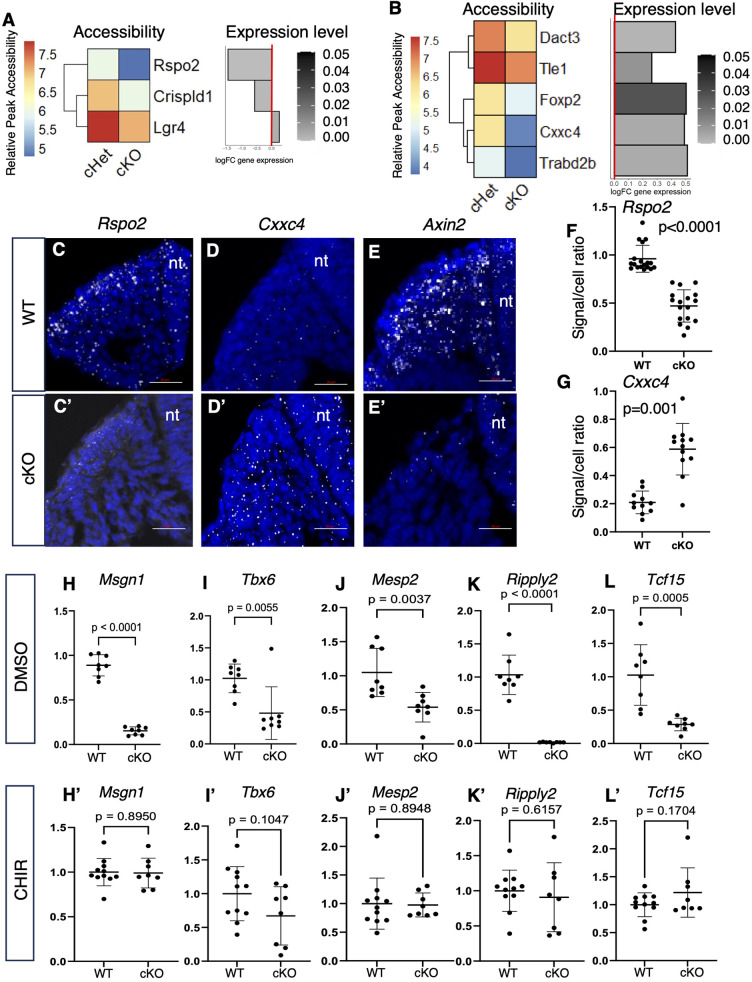
Fig. 5.
WNT regulators with differential accessibility and differential expression between Sall4 cHet and Sall4 cKO. (A) Heatmap and bar chart showing differential accessibility and expression of genes involved in activating WNT signaling. Gray shading indicates FDR. (B) Heatmap and bar chart showing differential accessibility and expression of genes involved in negative regulation of WNT signaling. Gray shading indicates FDR. (C-E′) RNA scope images of expression of Rspo2 (C,C′), Cxxc4 (D,D′) and Axin2 (E,E′) in the PM of the posterior trunk in wild-type (C-E) and Sall4 cKO (C′-E′) embryos at E9.5. DAPI signals and transcript signals are shown in blue and white, respectively. nt, neural tube. Scale bars: 20 µm. (F,G) Quantification of Rspo2 (F) and Cxxc4 (G) signals. Each dot represents data from a section. The y-axis shows the ratio between Rspo2 or Cxxc4 signal number and DAPI-positive nuclei number in the PM of the section. Data obtained from five wild-type and five Sall4 cKO embryos. P values are indicated (unpaired t-test). (H-L′) Relative expression levels of Msgn1 (H,H′), Tbx6 (I,I′), Mesp2 (J,J′), Ripply2 (K,K′) and Tcf15 (L,L′) in cultured E10.5 tail of wild-type or Sall4 cKO embryos in the presence of DMSO (H-L) or CHIR (H′-L′). Each dot represents a cultured tail and P values are shown in each panel (unpaired t-test).

