Figure 3.

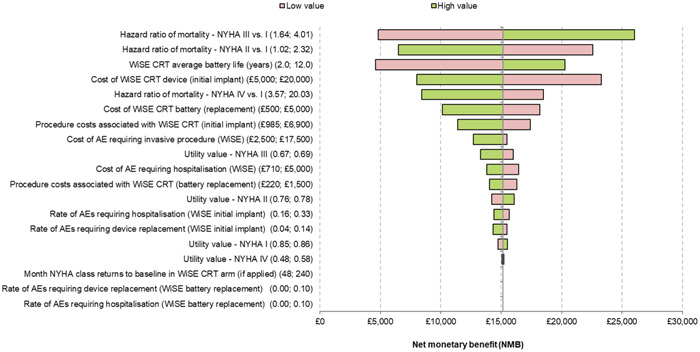
Tornado diagram showing results of deterministic sensitivity analysis using a £30 000 quality‐adjusted life year (QALY) threshold. The numbers in brackets indicate the high and low values for each parameter assessed.

Tornado diagram showing results of deterministic sensitivity analysis using a £30 000 quality‐adjusted life year (QALY) threshold. The numbers in brackets indicate the high and low values for each parameter assessed.