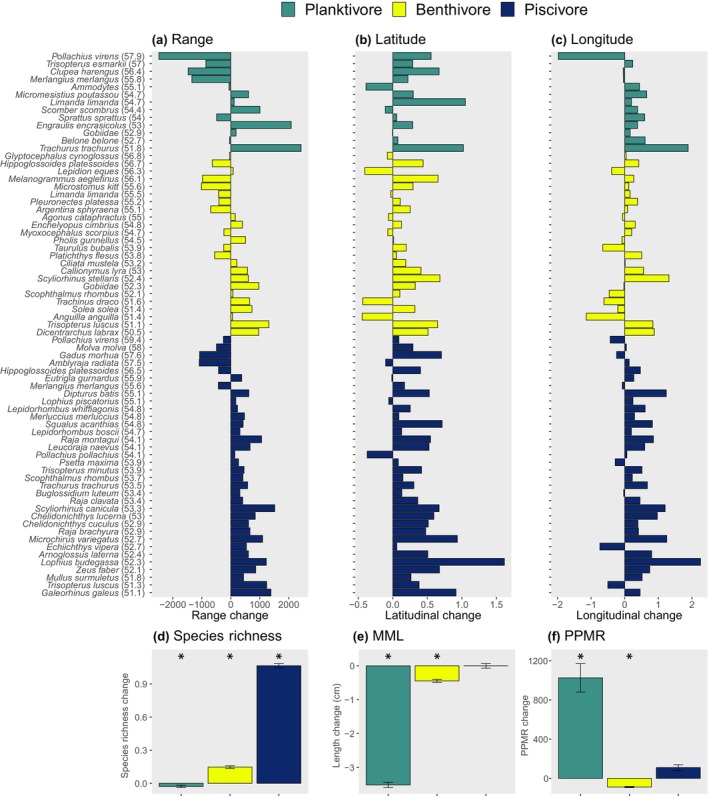
FIGURE 4.

Predicted change in the distribution of species assigned to feeding guilds, feeding guild species richness, mean maximum length (MML) and predator‐prey mass ratios (PPMR) from 2020 to 2095 based on RCP 4.5. Top row: species are ordered along the y‐axis by feeding guild and then their mean latitudinal values (in parentheses). Change in range (a) represents change in the number of cells occupied across the study region, each cell corresponding to an area of 100 km2. Latitudinal (b) and longitudinal (c) change represent shifts in the mean latitudinal and longitudinal values of cells occupied by species respectively. Species which appear multiple times on the y‐axis switch guilds through ontogeny, such as juvenile planktivorous dab (Limanda limanda) which develop into benthivores at larger size classes and can have differing habitat requirements (note contrasting latitudinal changes). Bottom row: mean cell‐level change in feeding guild species richness (d), MML (e) and PPMR (f), with error bars showing standard error and * indicating significant change between 2020 and 2095 values based on Kruskal–Wallis tests.
