
FIGURE 4.
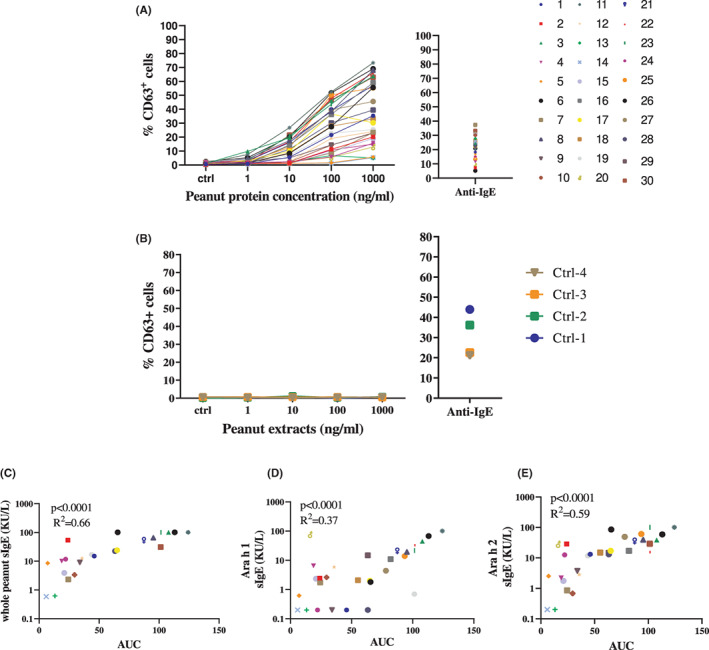
PCBAT with peanut allergen extracts on physician diagnosed peanut allergic patients. PCBAT using peanut allergen extracts (1, 10, 100 or 1000 ng/ml) were performed on (A) 30 subjects with physician diagnosed peanut allergy, and (B) on four atopic but non‐peanut‐sensitized subjects. The relationship between the PCBAT AUC from the sensitized groups and the corresponding whole peanut sIgE level Ara h 1 sIgE level and Ara h 2 sIgE level were shown in scatter plot (C–E, respectively). Spearman test and R square was calculated and p < .05 were considered significant.