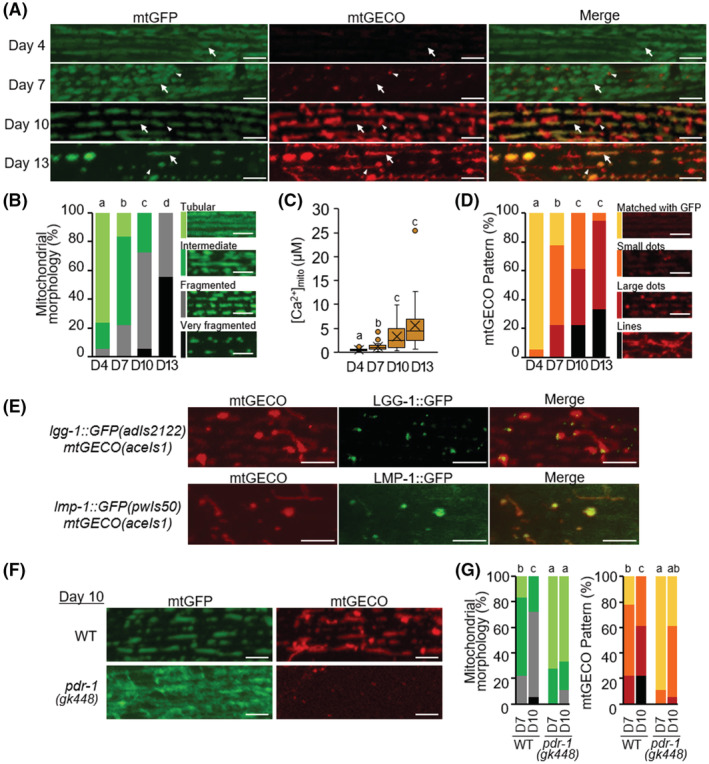
FIGURE 1.

Decrease in mitochondrial volume and increase in mitochondrial Ca2+ level with age. (A) Representative fluorescence images of body wall muscle cells in transgenic C. elegans expressing mitochondria‐targeted GFP (mtGFP) and a mitochondrial Ca2+ probe (mtGECO) in the body wall muscle cells in WT worms (ccIs4251; aceIs1) at D4, D7, D10, and D13 of adulthood. The arrows indicate the typical position, where Ca2+ concentration in mitochondria ([Ca2+]mito) was measured in (C). The arrowheads indicate the position of mtGECO structures that are no longer colocalized with mtGFP. Scale bars: 5 μm. (B) Qualitative analysis of body wall muscle cells with abnormal mitochondrial morphology. On the left, light green, green, light gray, and black represent fractions containing cells with “tubular,” “intermediate,” “fragmented,” and “very fragmented” mitochondria, respectively. The right panels show representative images of the categorized mitochondria. Scale bars: 5 μm. Data represent the value from 18 cells from at least 6 worms. (C) Age‐dependent elevation in [Ca2+]mito of muscle cells. Calcium levels of mtGFP‐positive mitochondria as shown by arrows in (A) were calculated from the ratio of fluorescence intensity of mtGECO to that of GFP in a constant area described in Materials and Methods. Data represent the value from 19 to 21 cells from at least six worms. (D) Qualitative analysis of body wall muscle cells with different mtGECO patterns. On the left, yellow, orange, red, and black represent fractions containing cells with the mtGECO signal “matched with GFP,” and the fractions of the cells that showed “small dots,” “large dots,” and “lines” of mtGECO signal, respectively. The right panels show representative images of the categorized patterns. Scale bars: 5 μm. Data represent the value from 18 cells from at least 6 worms. (E) Colocalization of mitophagy‐related proteins with mtGECO‐accumulated dots and tubular structures in D10 muscle cells. Representative fluorescence images of transgenic pC. elegans (adIs2122 [Plgg‐1::lgg‐1::GFP]; aceIs1) expressing mtGECO and GFP‐tagged LGG‐1 and transgenic C. elegans (pwIs50 [Plmp‐1::lmp‐1::GFP]; aceIs1) expressing mtGECO and GFP‐tagged LMP‐1. Scale bars, 5 μm. (F) Representative fluorescence images of mtGFP and mtGECO in body wall muscle cells in WT (ccIs4251; aceIs1) and pdr‐1(gk448) worms at D10 of adulthood. Scale bars: 5 μm. (G) Qualitative analysis of body wall muscle cells with abnormal mitochondrial morphology and different mtGECO patterns (n = 18 muscle cells from at least six worms). Color‐coding bars are the same as in (B) and (D). Letters on the tops of bars indicate statistical significance by the chi‐square test (B, D, G) or one‐way ANOVA with Dunn's multiple comparison tests (C) (p < .05).
