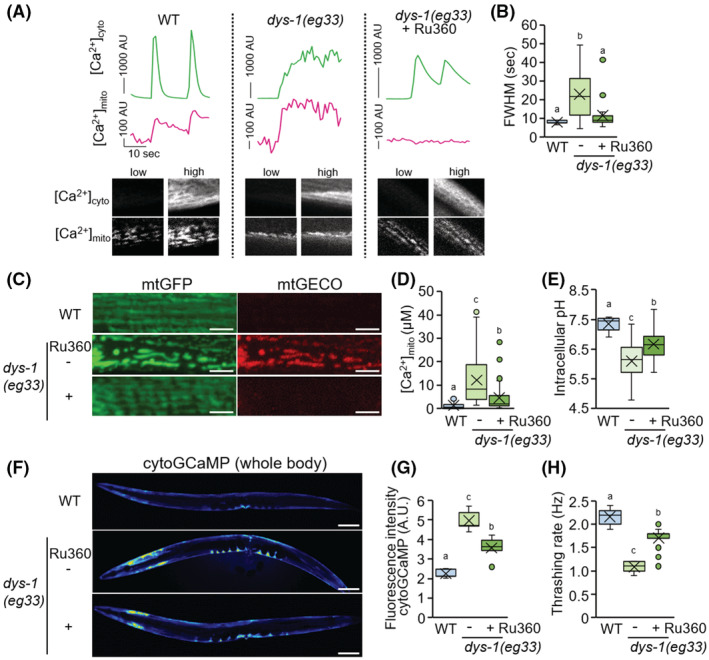
FIGURE 5.

Effect of Ru360 treatment on C. elegans dystrophy model. (A) Mitochondrial Ca2+ uptake (magenta) during spontaneous cytosolic Ca2+ fluctuations (green) in body wall muscles of immobilized WT worm (goeIs3; aceIs1, left panel), dys‐1(eg33) (center panel), and Ru360‐treated dys‐1(eg33) (right panel). Fluorescent signals of cytosolic GCaMPs and mtGECO were monitored simultaneously. Typical fluorescent images of muscle cytosolic GCaMP and mtGECO at low and high levels were shown in the bottom panel. (B) Full width half maximum (FWHM) of the [Ca2+]cyto peaks in WT (goeIs3; aceIs1), untreated and Ru360‐treated dys‐1(eg33) mutant worms (n = 16–20). (C) Representative fluorescent images of mitochondria and mtGECO in the body wall muscle cells. Scale bars: 5 μm. (D) Mitochondrial Ca2+ levels in mtGFP‐positive mitochondria of muscle cells on D2 of adulthood. The levels were calculated as described in Materials and Methods (n = 31–39). (E) Intracellular pH in body wall muscle cells in WT (N2) and untreated and Ru360‐treated dys‐1(eg33) mutant worms on D3 of adulthood (n = 11–13). (F and G) Fluorescent images (F) and fluorescence intensity (G) of the whole body of transgenic C. elegans expressing a cytosolic Ca2+ probe (GCaMP) in body wall muscle cells. The dys‐1(eg33) mutant exhibited higher fluorescence intensity for cytosolic GCaMP than the WT worms, and Ru360 treatment rescued this change. Scale bars: 100 μm. (H) Thrashing rate (Hz) in WT (goeIs3; aceIs1), untreated and Ru360‐treated dys‐1(eg33) mutant worms. Inhibition of mitochondrial Ca2+ uptake by Ru360 improved the decline in motor activity (thrashing) of the dys‐1(eg33) mutant (n = 25). Letters on the tops of bars indicate statistical significance by one‐way ANOVA with Dunn's multiple comparison test (B, D, E, G, H) (p < .05).
