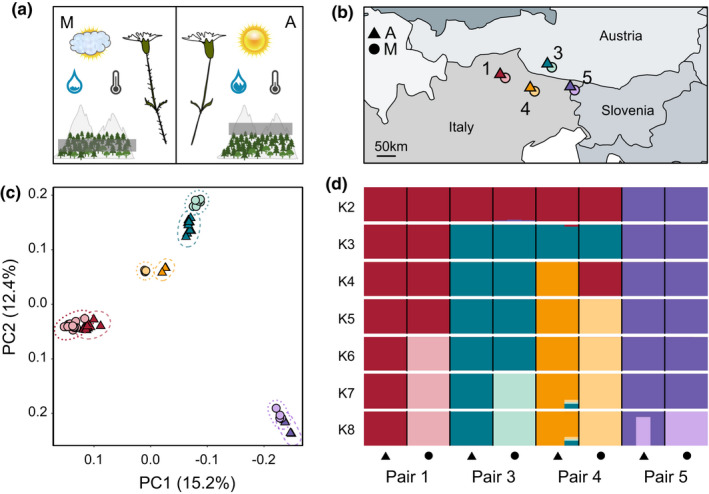
FIGURE 1.

Study system, sampling setup and genetic variation among four montane (M, circles) – alpine (A, triangles) ecotype pairs of Heliosperma pusillum. Colour coding of populations is consistent across panels. The numbering of the ecotype pairs is consistent with previous work (Bertel et al., 2018). (a) Graphic description of the main ecological and morphological differences between the ecotypes. (b) Geographical map showing the location of the analysed populations in the southeastern Alps. (c) Clustering of individuals along the first two vectors of a principal component analysis. (d) Bar plot showing the assignment of individuals to the clusters identified by ngsadmix for K = 2–8
