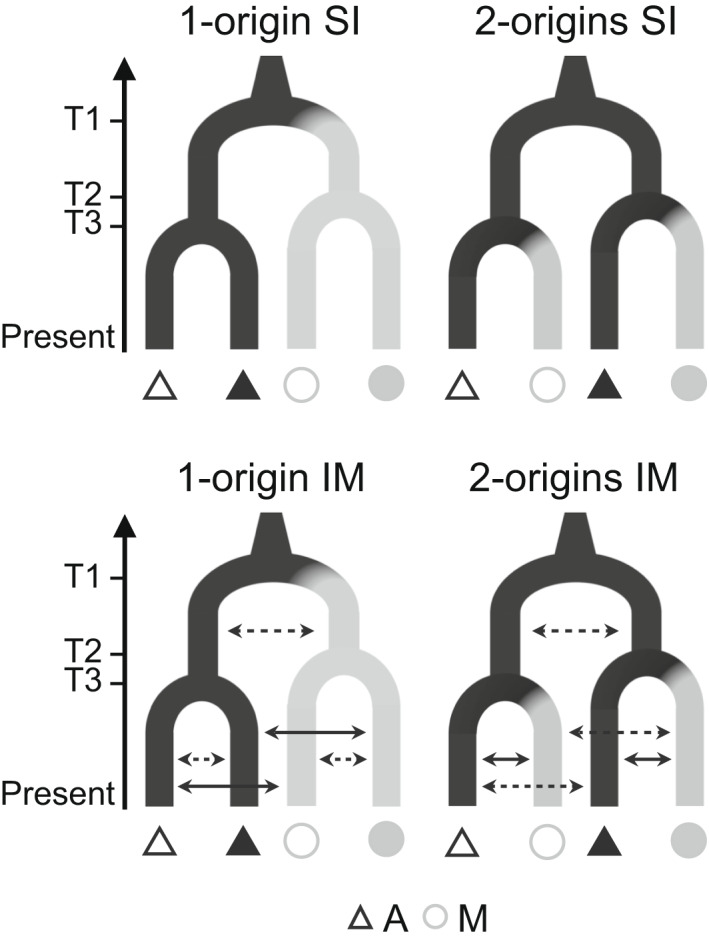
FIGURE 2.

Alternative topologies tested using fastsimcoal2 for all combinations of two ecotype pairs. Strict isolation (SI, upper panels) and isolation with migration (IM, lower panels) were modelled. Solid arrows in the IM models indicate higher migration rates expected between ecotypes at each locality according to population structure results. Divergence times T2 and T3 were allowed to vary (i.e., T2 > T3 but also T3 > T2 were modelled), whereas T1 was always the oldest event. Triangles and circles represent populations of the alpine (A) and the montane (M) ecotype, respectively. Filled and empty symbols represent different ecotype pairs
