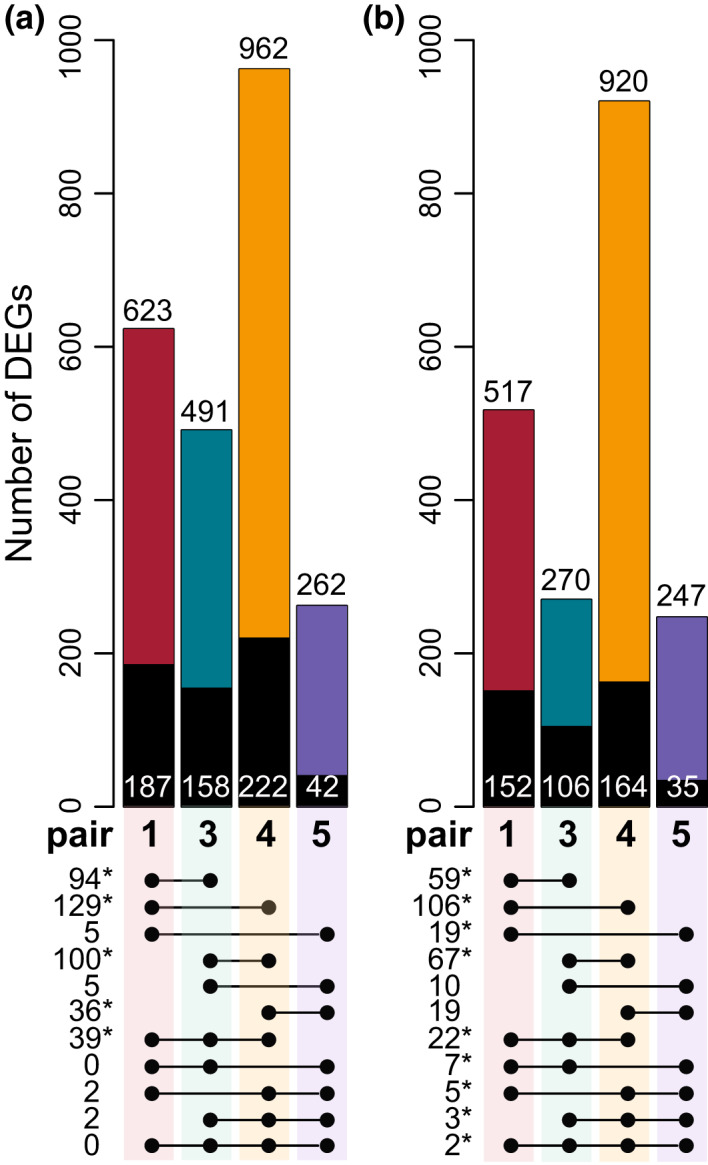
FIGURE 3.

Differentially expressed genes (DEGs) at each ecotype pair show low overlap across different pairs. Histograms show the number of DEGs (FDR < 0.05) underexpressed (a) and overexpressed (b) in the montane compared to the alpine ecotype in each pair. Numbers reported on top of the bars show the total number of DEGs between ecotypes per pair and category. Numbers on the black areas show the number of DEGs shared with at least one other pair. Linked dots below bars show the number of shared DEGs between two, three or four pairs. Stars indicate that the overlap is significantly higher than chance expectations (hypergeometric test, p < .01)
