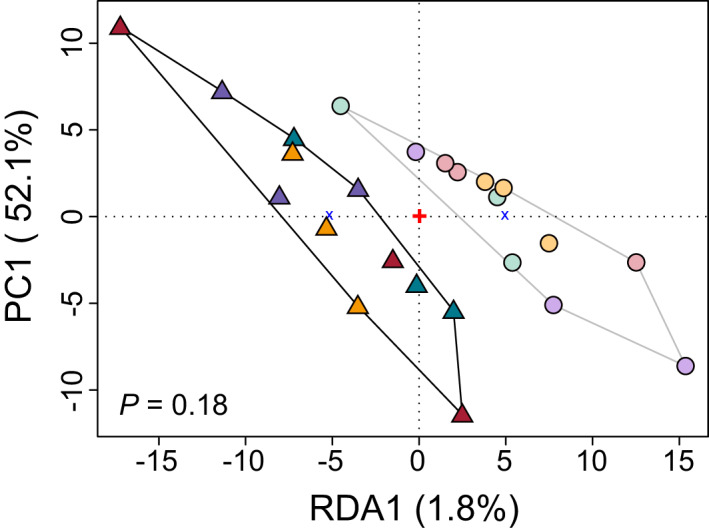
FIGURE 4.

Expression divergence between accessions of the alpine and the montane ecotypes captured with conditioned redundancy analysis (cRDA). Colours represent the populations as in Figure 1. Triangles and circles represent alpine (A) and montane (M) individuals, respectively, whereas the clusters delimited by black and grey lines correspond to the alpine and the montane ecotypes, respectively. The ANOVA test of the full model was not significant (p = .18), confirming that most expression differences between ecotypes in our data set do not follow consistent routes across ecotype pairs
