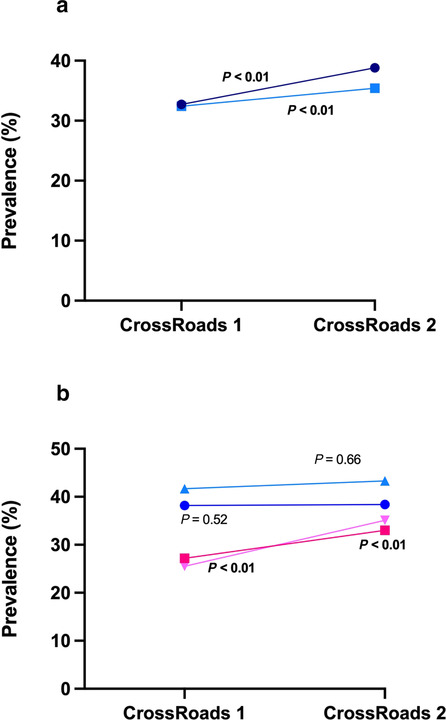
Figure 1.

Changes in NAFLD prevalence. (A) Entire cohort.  , NAFLD crude;
  , NAFLD standardized. (B) according to gender.
  , NAFLD male standardized;
  , NAFLD female standardized;
  , NAFLD male crude;
  , NAFLD female crude.

Changes in NAFLD prevalence. (A) Entire cohort.  , NAFLD crude;
  , NAFLD standardized. (B) according to gender.
  , NAFLD male standardized;
  , NAFLD female standardized;
  , NAFLD male crude;
  , NAFLD female crude.