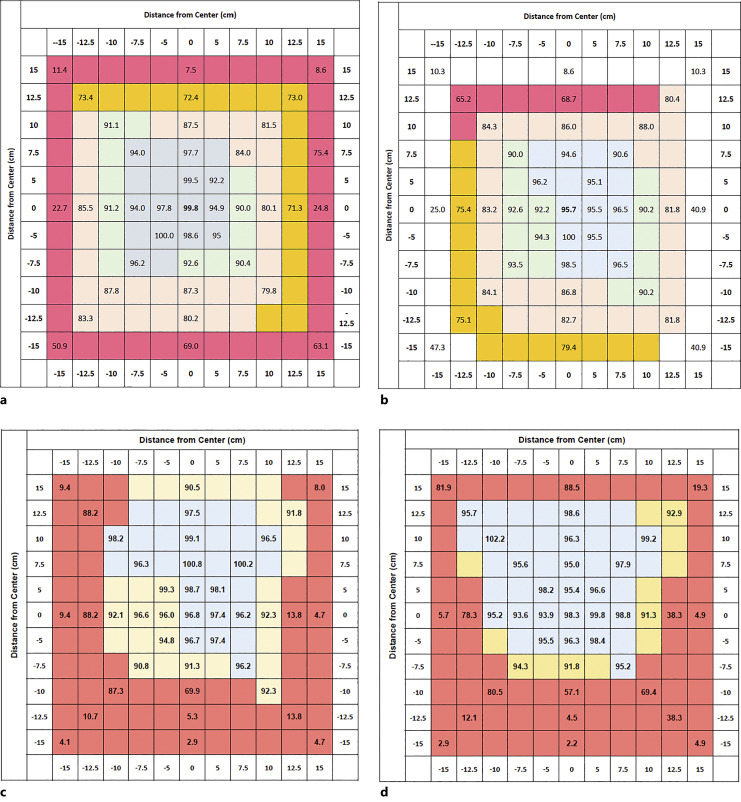
Fig. 5.
Representative dosimetry maps demonstrating effect on dose distribution from energy output, fluence, and filtration. a and b are images of dose distribution maps from the same cabinet style X-ray irradiator delivering a 4 Gy dose under two different energy output settings and with two different amounts of beam filtration, while c and d are dosimetry maps from a second cabinet style X-ray unit delivering the same dose but under different energy and beam conditions.

