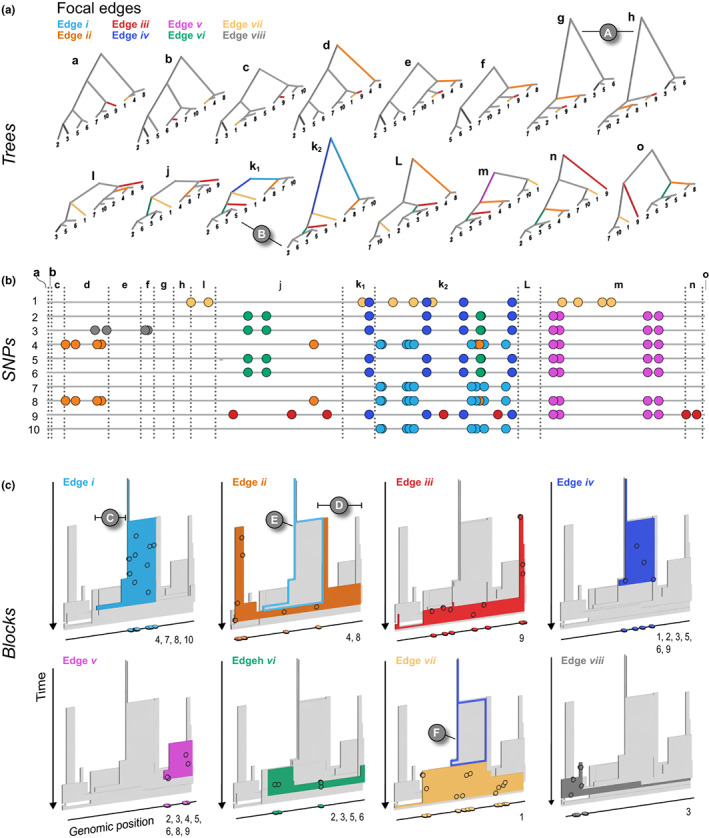
FIGURE 3.

The relationship between trees (a), SNPs (b) and haplotype blocks (c) in the neutral simulation (see main text for simulation details). The ARG has been decomposed into marginal trees (a–o) to show all of the unique topologies that coincide with the genomic spans shown in the central panel (also labelled a–o). The branches for each tree are coloured according to the eight edges in the ARG that we chose to focus on (also labelled i–vii). A: two neighbouring topologies that differ only slightly due to recombination. B: an example of two trees (k1 and k2) that have the same topologies but different lengths. The central panel shows 10 haploid genomes (labelled 1–10, top to bottom, coinciding with the tips of the trees). The SNPs that arose on the eight focal edges are indicated by the coloured circles. The lower panel (c) shows the haplotype blocks for each edge. The coloured block in each panel is the focal edge, with the other seven blocks shown in grey. The mutations shown in the central panel are projected onto each block (black circles) at the genomic location and time that they arose. They are also plotted onto the genomic position axis to make the connection with the panel b more explicit. Similarly, the numbers at the bottom right corner indicate which DNA sequences the mutations are associated with. C and D: Examples of regions of blocks that, by chance, are not revealed by mutations arising on the corresponding edge. E and F: Examples of nested haplotype blocks, where the ancestral block is highlighted with a coloured outline
