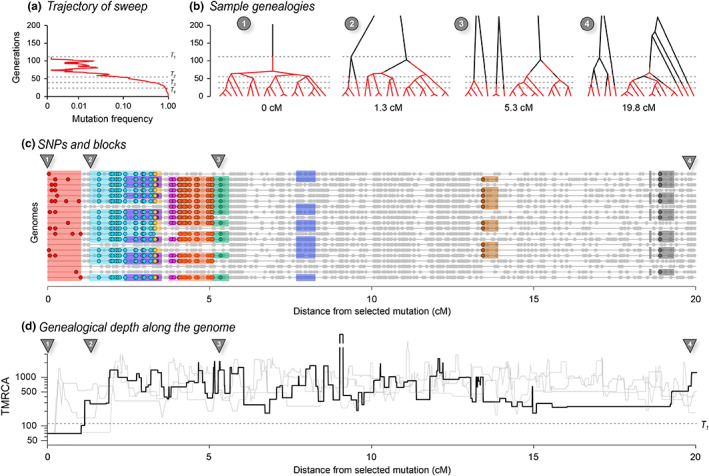
FIGURE 4.

The effects of a recent selective sweep on linked genealogies. (a) A mutation with advantage 10% arose in a population of 400 haploid individuals, and swept to fixation in 110 generations, at which time 20 genomes were sampled; 20 cM of the genome is followed back in time, with the selected locus at the left; dashed lines (T1–T4) show times when the favoured allele was in one copy, at 10%, at 50% and at 90% (110, 53, 38 and 22 generations back). (b) Genealogies at positions 0, 1.3, 5.3 and 20 cM; branches are coloured in red when on the fitter background and black when on the ancestral background. Thus, changes in colour show recombination events that change the genomic background. Note that such events are unlikely when the allele is near fixation (i.e., at the base of the tree, below the lower dashed line) and, conversely, become common when the allele is rare, simply because it will almost always meet with the opposite background. Before the mutation occurs (i.e., above the upper dashed line) lineages must either trace back to that mutation (top left) or recombine out into the ancestral background; thus, all lineages must appear black above the upper dashed line (110 generations back). Note that the disjunct branches in trees 2–4 all coalesce further back in time, but only 200 generations are shown for visibility. (c) SNPs along the 20 sampled genomes. Nine of the most substantial branches are shown. (These have more than eight descendants, formed by coalescence more recently than the sweeping mutation, and have areas >0.5.) The red block at the left shows the region linked to the selected locus, which coalesces in a single common ancestor 69 generations back, just after the sweeping mutation arose. Grey dots show those SNPs that are not on these nine highlighted branches. (d) The time back to the most recent common ancestry (TMRCA) along the genome, on a log scale. The bold line shows the example simulated above, whilst the three grey lines show replicates, generated conditional on the same sweep; the break in the line shows an area where the TMRCA extends further back than the extent of the y‐axis. The dashed line across the plot corresponds to T1 in (a)
