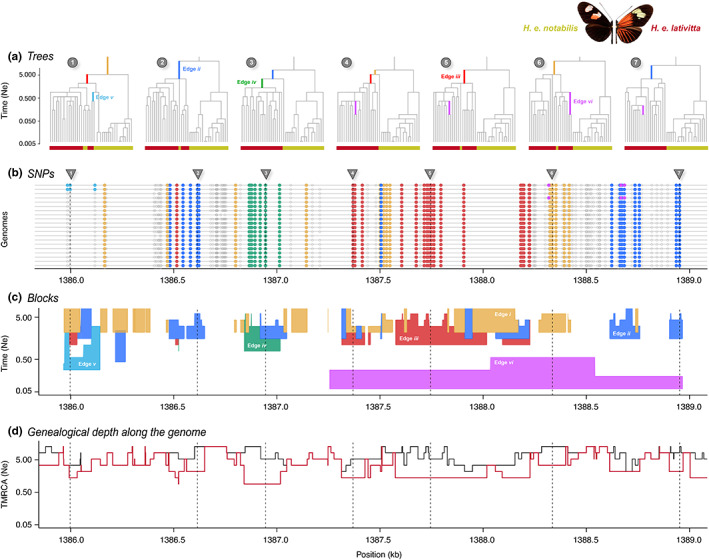
FIGURE 5.

Visualization of haplotype blocks based on application of argweaver to the optix region of Helconius erato butterflies (2n = 20). (a) Genealogical trees at each genomic point, marked by arrows and corresponding numbers. Genomic points are chosen to show all coloured edges as branches on the corresponding marginal trees. Red labels: H. e. lativitta samples; yellow labels: H. e. notabilis samples. Branches on trees are coloured according to the corresponding edges in (c). Both highland H. e. notabilis (2n = 20) and lowland H. e. lativitta (2n = 20) populations are included in the analysis so that we can estimate the length of branches that are ancestral to all H. e. lativitta samples (2n = 20), but (b)–(d) only exhibit features related to the H. e. lativitta population. (b) Genomic location of SNPs for all 20 H. e. lativitta haploid samples. Out of a total of 137 SNPs, only those that explain the six substantial edges are coloured accordingly. Edges are defined as substantial if three or more SNPs occur on them. Two out of six edges (v and vi) are explained by doubleton SNPs, whereas the rest are fixed within the H. e. lativitta samples. SNPs that do not appear on any significant edge are coloured grey if they have higher allele frequency within the samples, white otherwise. (c) Visualization of haplotype blocks as edges similar to Figure 3, plotting blocks along the genomic (x‐axis) and temporal span (y‐axis). Since edges always originate at a fixed coalescent time point, the bottom line of the block is always smooth. The ragged tops of the blocks denote the length of the edges interrupted by recombination events. Note that edges can also be disjunct due to one or more samples and recombining out and back into the same lineage. (d) Relative TMRCA half‐life estimates along the genome: Black: total TMRCA to all 40 samples; red: TMRCA to only H. e. lativitta samples
