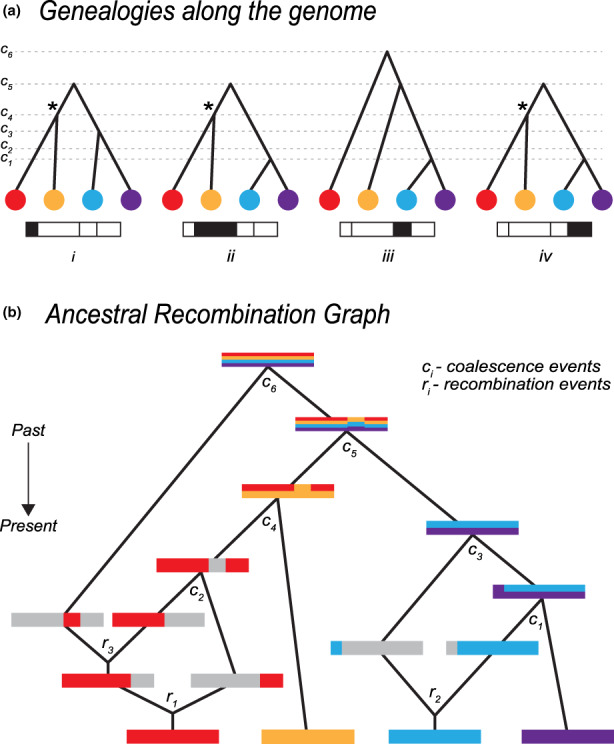
FIGURE A1.

Relationship between genealogies and the ancestral recombination graph (ARG). (a) Genealogical trees along the genome, corresponding to the ARG—Each tree describes the ancestral relationship for each of the four nonrecombined regions. c 1, c 2, …, c 6 denote time points for each coalescence event. Trees can either change, have the same topology or marginally differ by only temporal positions of coalescence nodes. An asterisk (*) denotes a unique coalescence event that is ancestral to disjunct genomic regions. (b) Full representation of the ARG. Tracing back ancestry of four genomes, there is either recombination splitting lineages or coalescence merging lineages. Inherited ancestral genomic regions are coloured corresponding to the contemporary genomes. Recombination is represented by splitting the genome into two, where grey denotes a nonancestral genomic region. Coalescence is represented by two genomes merging, with inherited genomic regions denoted by mixed colours. There are three recombination and six coalescence events in the full ancestral history of the four genomes. c 1, c 2, …, c 6 denote time points for each coalescence event. r 1, r 2 and r 3 denote time points for each recombination event
