
FIGURE 2.
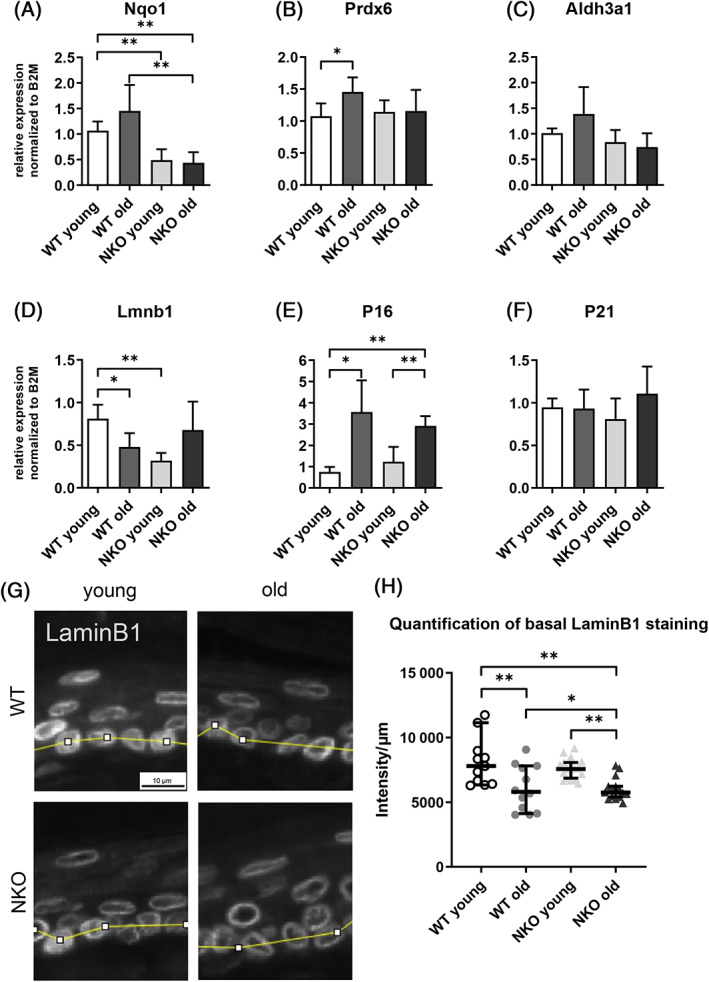
Gene expression of selected epidermal Nrf2 targets and senescence markers. Relative gene expression of the Nrf2 targets Nqo1 (A), Prdx6 (B), Aldh3a1 (C) and the senescence markers LaminB1 (D), p16 (E), p21 (F) on mRNA level in murine epidermis quantified by qPCR and normalized to the expression of beta‐2‐microglobulin (B2M). Asterisks indicate statistically significant differences (*p < 0.05, **p < 0.01, one‐way ANOVA with Newman–Keuls correction for multiple comparisons. Results are depicted as mean value with standard deviation. N = 4). (G) Image section of representative LaminB1 staining of mouse tail sections of young and old wildtype (WT) and Nrf2 deficient (NKO) animals. The yellow segmented line indicates the cross section through the basal layer used for LaminB1 intensity measurement. Scale bar: 10 μm. (H) Plot of background subtracted average LaminB1 staining intensity per micrometer through a cross section of the basal layer. Quantification data from 4 field of view per mouse, 3 mice per genotype & age group. Asterisks indicate statistically significant differences (*p < 0.05, **p < 0.01, one‐way ANOVA with Tukey's correction for multiple comparisons. Results are depicted as median with 95% confidence interval.)