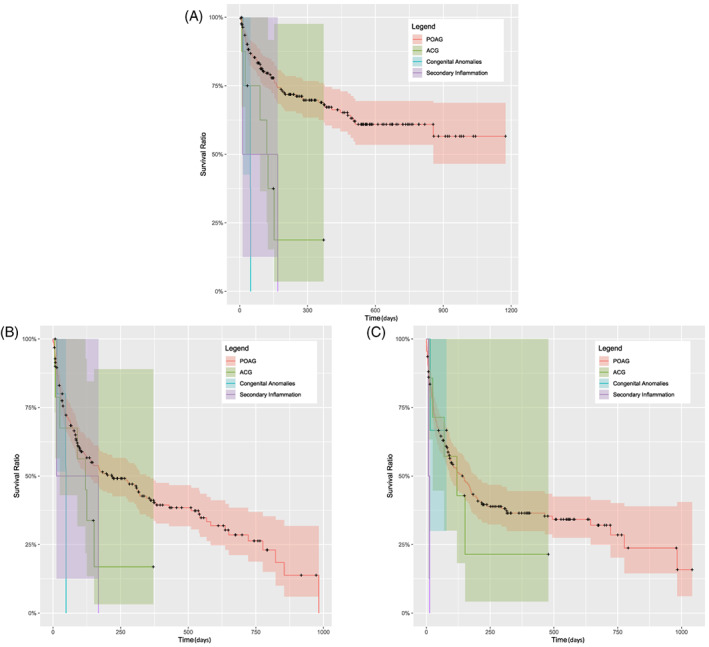
FIGURE 3.

Kaplan–Meier survival cases by glaucoma diagnosis subgroup (A–C) by criterion 1 (A), by criterion 2 (B), by criterion 3 (C). Solid lines show the cumulative probability of success and the shaded areas show the 95% confidence intervals. POAG indicates primary open angle glaucoma and ACG indicates angle closure glaucoma.
