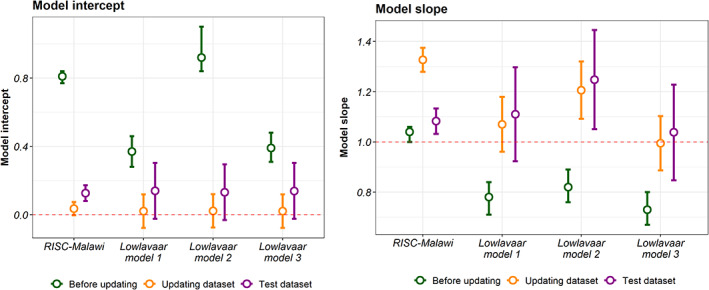
FIGURE 2.

Calibration performance of the models in various datasets. The left panel shows calibration intercept while that on the right shows model slope. The coloured points and the 95% confidence intervals (shown as errors bars) shows the model calibration performances in the external validation, updating dataset (for model recalibration), and in the test dataset. The dotted line denotes the references of the model intercept (α = 0) and slope(β = 1) for a perfect calibrated model.
