
FIGURE 4.
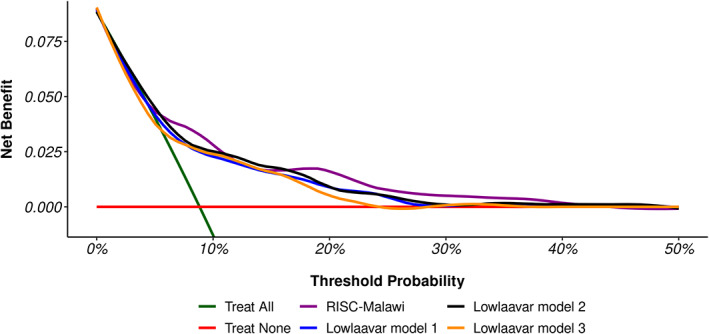
Decision curve analysis for the patients meeting the eligibility of all models. The “Treat All” line chart assumes all patients are at an increased risk of deterioration hence all should be prioritised for treatment, whereas the “Treat None” line chart assumes that no one is at the risk of deterioration hence none to be prioritised for treatment. The four coloured line charts show the net benefit of using models to identify patients at risk of deterioration.