
FIGURE 4.
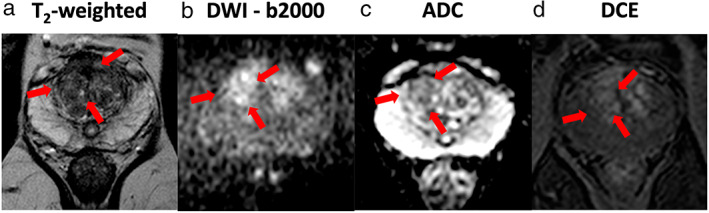
Example of the mpMRI data from a subject with PCa. (Left to right) (a) T2‐weighted image (T2W), (b) diffusion‐weighted Image (DWI)—b2000, (c) apparent diffusion coefficient (ADC) map and (d) dynamic contrast‐enhanced MRI (DCE). In each image, the tumor location is outlined with red arrows.