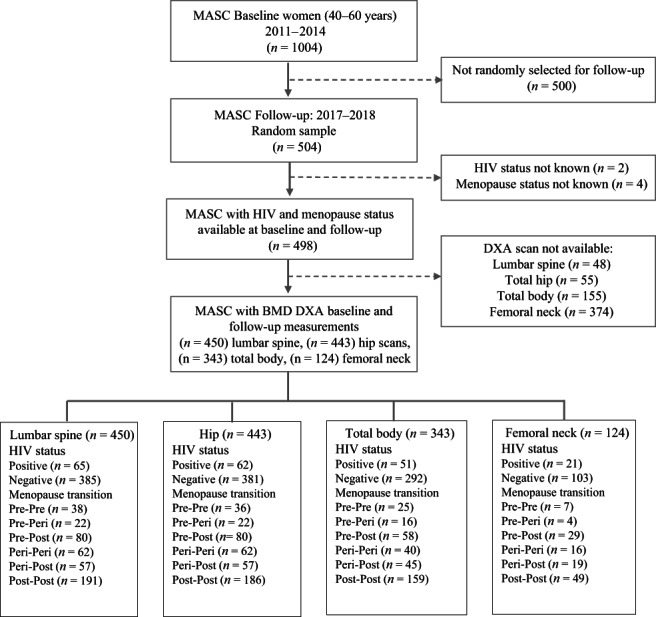
Fig. 1.

Participant recruitment flow diagram explaining selection of women in Middle‐Aged Soweto Cohort (MASC) study. The flow chart shows the selection of participants in the MASC study at baseline and follow‐up. In addition, the figure summarizes the distribution of data by BMD site, menopause group, and HIV status.
