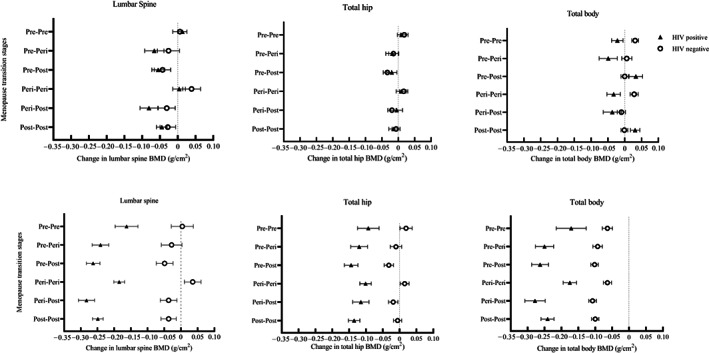
Fig. 2.

Absolute changes in BMD in menopause transition stages among women living with and without HIV (top row: unadjusted) (bottom row: adjusted for age and weight at baseline, change in weight, and follow‐up time). Graphs show univariable and multivariable effects of menopause transition on LS, TH, and TB BMD in top and bottom rows, respectively. Linear regression estimates are shown; β (standard error) representing g/cm2 losses/gains in BMD over follow‐up period as distinguished by a reference line (x = 0). Individuals with HIV are indicated by triangles and those without HIV by circles. The prevalence of HIV in this population was 14.4%, and at follow‐up, most women (72.9%) were postmenopausal. Evidence of interaction between pre‐post, post‐post MT groups and HIV status on TB BMD was detected in adjusted analyses.
