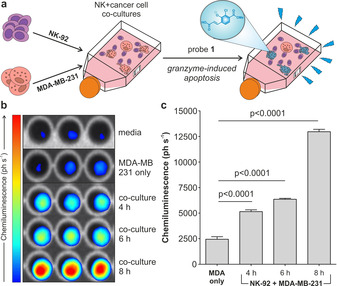
Figure 3.

a) Representation of the co‐culture chemiluminescence assay to measure granzyme B‐mediated activity of NK cells against cancer cells. b) Chemiluminescence images of probe 1 (500 μm) incubated with either media only, MDA‐MB‐231 cells alone or co‐cultures of MDA‐MB‐231 cells NK‐92 cells for indicated times. c) Quantification of the chemiluminescence (in ph s−1) generated by probe 1 for different conditions. Data as means±SEM (n=3). P values from ONE‐ANOVA tests with multiple comparisons.
