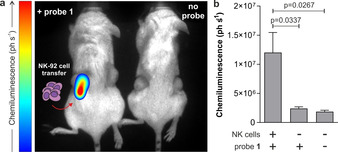
Figure 4.

a) In vivo representative chemiluminescence images (from 3 independent experiments) of NSG mice containing MDA‐MB‐231‐xenograft tumours where NK‐92 cells were adoptively transferred. In all mice, MDA‐MB‐231 xenograft tumours were grown to 0.5–1 cm diameter in size. Left) only the right tumour (red arrow) was injected with NK‐92 cells (2×10⁶ cells/mouse) with the left tumour being NK cell‐free. After 8 h of the NK cell injection, probe 1 (125 μg) was injected to both tumours. Right) control animal with no injection of probe 1. Whole‐body images were acquired immediately after injection of probe 1 and processed with M3Vision™ software. b) Quantification of chemiluminescence emission (ph s−1) for each condition displayed. Data as mean values±SEM (n=3). P values obtained from ONE‐ANOVA tests with multiple comparisons.
