
FIGURE 2.
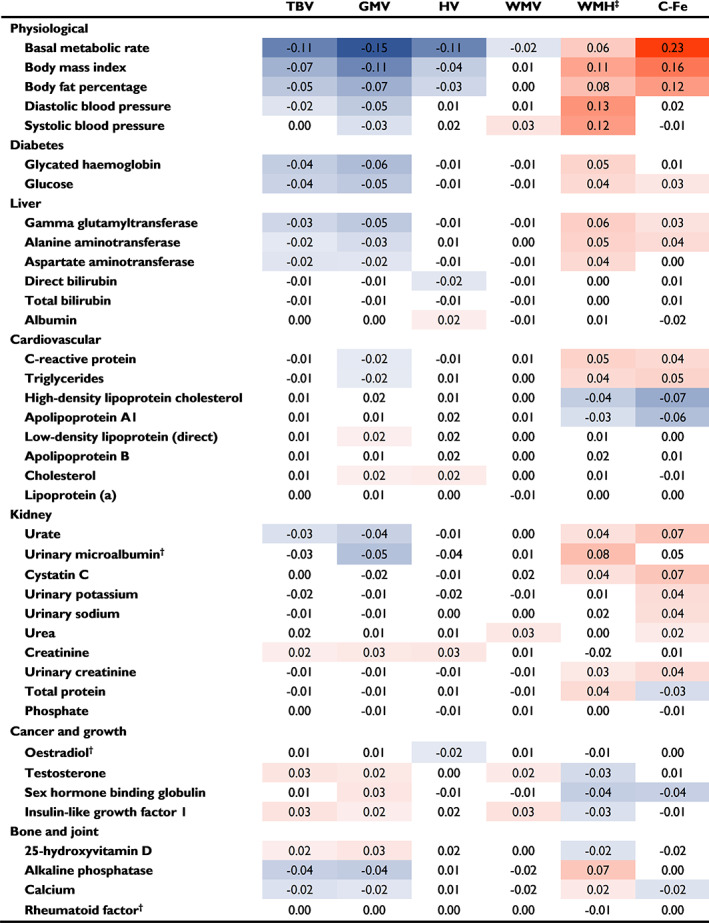
Metabolic biomarker associations with brain MRI parameters. Standardized beta estimates are shown for each neuroimaging marker, per one‐standard deviation higher metabolic biomarker level. Biomarker data were sex‐standardized, and log‐transformed †with the exceptions of oestradiol, microalbumin and rheumatoid factor, which were analysed without log transformation due to many values being zero. All analyses were adjusted for age, sex, assessment centre, socioeconomic (education, Townsend deprivation index, employment) and lifestyle factors (smoking, alcohol consumption, physical activity, stress, diet). Caudate iron deposition analyses were also adjusted for dietary iron. All brain MRI data were normalized to total head size, and *white matter hyperintensity (WMH) volume data were inverse normal transformed to approximate normal distribution. Estimate values with P values below the Bonferroni‐adjusted threshold (P < 0.0013) are indicated in colour, with orange indicating higher values, and blue indicating lower values, and more intense colour representing greater deviation of the point estimate from zero. Confidence interval and P‐value information can be found in Supplementary Table 3. Abbreviations: C‐Fe, caudate iron (R2*); GMV, grey matter volume; HV, hippocampal volume; TBV, total brain volume; WMV, white matter volume