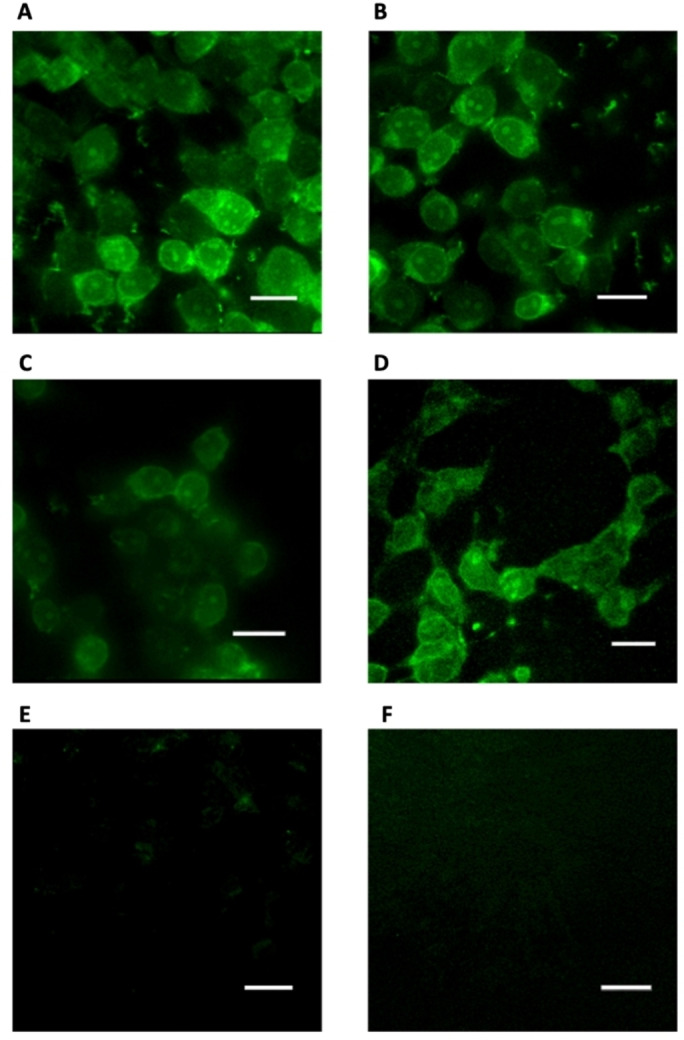
Figure 5.

Fluorescence imaging showing A) the diyne‐girder T‐STAR S7S7 stapled peptide 29, B and C) alkene stapled peptides 37 & 38 and D) diyne‐girder T‐STAR S7HS7H stapled peptide 39 internalised in cells. E) The native T‐STAR peptide 26 showed no internalisation. F) DMSO negative control. Microscopy images were acquired with a custom‐built multi‐modal microscope setup. Fluorescein excitation was conducted at 495 nm. Scale bars=40 μm. Images were processed using MetaMorph software.
