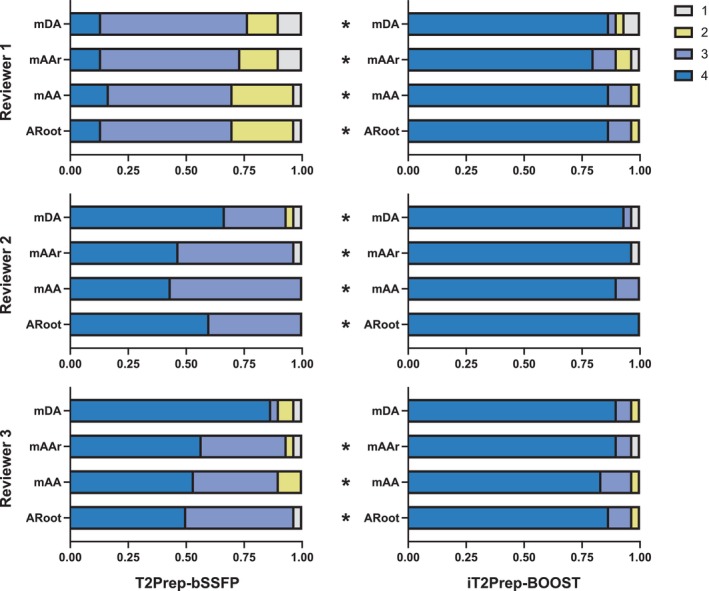
FIGURE 5.

Image quality scores analysis with respect to presence of artifacts in the images (1 = severe artifact, 4 = minimal artifact) for the proposed iT2Prep‐BOOST (right) in comparison to the clinical T2Prep‐bSSFP (left) bright‐blood images. Scores for the three reviewers are shown, at the mid descending aorta (mDA), mid aortic arch (mAAr), mid ascending aorta (mAA) and aortic root (ARoot) levels. *indicates that iT2Prep‐BOOST quality scores are significantly higher than T2Prep‐bSSFP scores, in the other cases the difference is not statistically significant.
